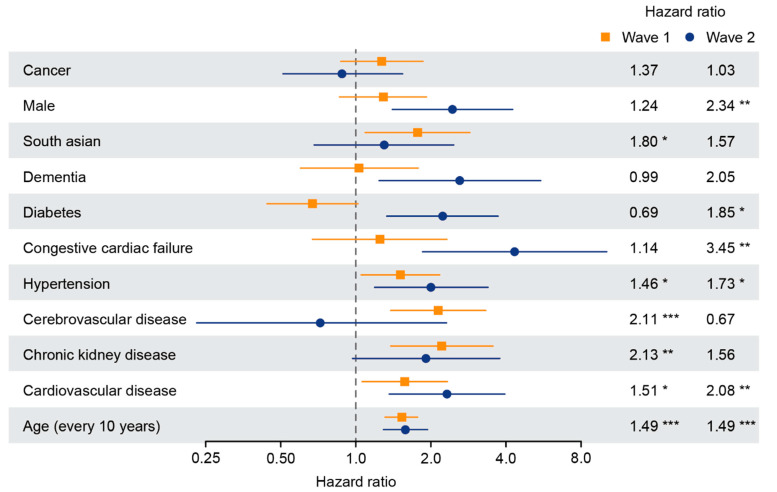
Figure 3.
Univariate risk factors for COVID-19 mortality in wave one and wave two in hospitalized patients with or without cancer. Forest plot showing the hazard ratios from univariate analyses of risk factors associated with mortality in COVID-19. Horizontal bars indicate 95% confidence interval. *, p < 0.05; **, p < 0.01; ***, p < 0.001.

