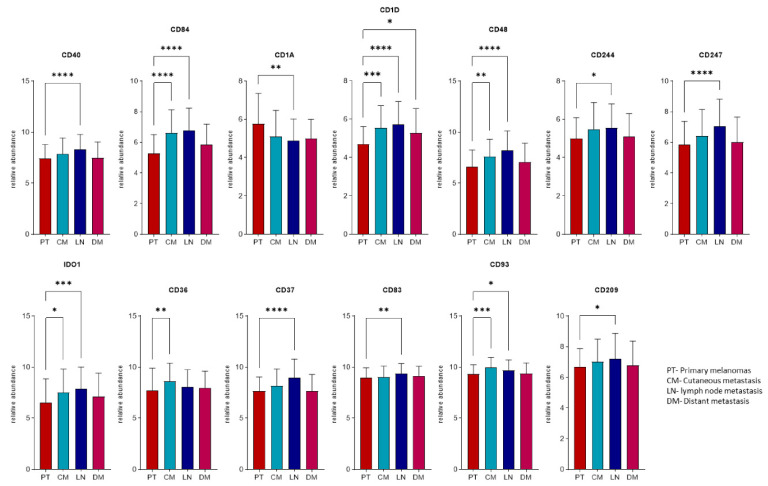
Figure 5.
Relative abundance levels of the transcripts differentially expressed in at least one group of metastases relative to primary melanomas. Asterix represents the level of significance (* p < 0.05; ** p < 0.01; *** p < 0.001; **** p < 0.0001) using analysis of variance (ANOVA) test adjusted with the Benjamini–Hochberg method and an additional Tukey–Kramer post hoc test for each ANOVA analysis.

