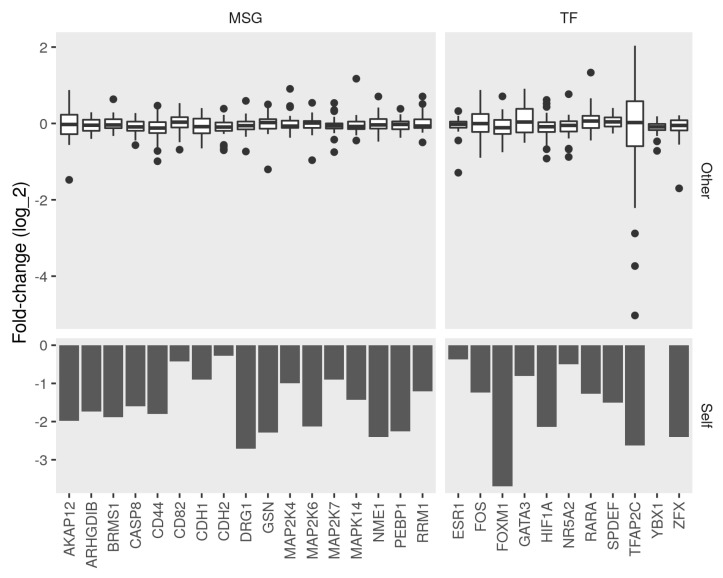
Figure 2.
Fold-change between control and knockdown of metastasis suppressors and transcription factors. We obtained expression profiles of seventeen metastasis suppressor genes (MSG) and eleven transcription factor (TF) knockdowns in the MCF7 cell line. We calculated the differential expression between the knockdown and control samples. Bottom, bars represent the fold-change (log) of the target gene (Self) between the control and knockdown. Top, box plots represent the distribution of the fold-change of (Other) MSGs and TFs in the corresponding knockdown condition.

