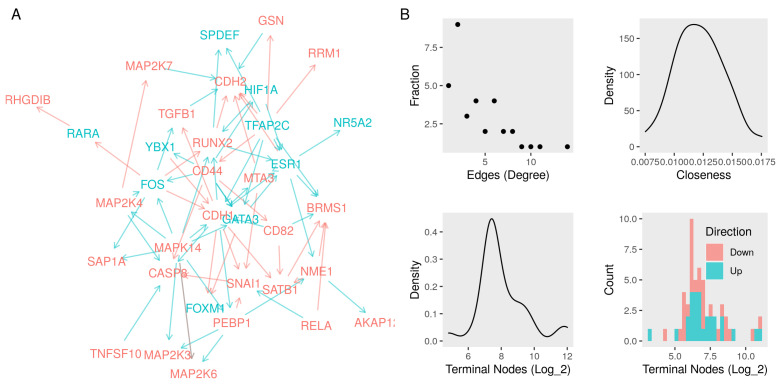
Figure 3.
Network of interactions among metastasis suppressors and their regulators. (A) A network graph of seventeen metastasis suppressors and eleven transcription factor nodes. We curated the edges (red, repression or blue, activation) from protein–protein interactions, literature survey, and context-specific gene expression data (Functional layer). (B) Top left, the fractions of nodes with a given number of edges (degree). Top right, the density function of the sum of the shortest paths between every node and all others (closeness). We built a transcript layer of significant changes in gene expression (absolute log fold-change > 0.5 and p-value < 0.01) as a result of knocking down every node in the functional layer. Bottom left, the density function of the numbers of nodes in the transcript layer connected to the nodes in the network. Bottom right, a histogram of the numbers up-and down-regulated nodes in the transcript layer.

