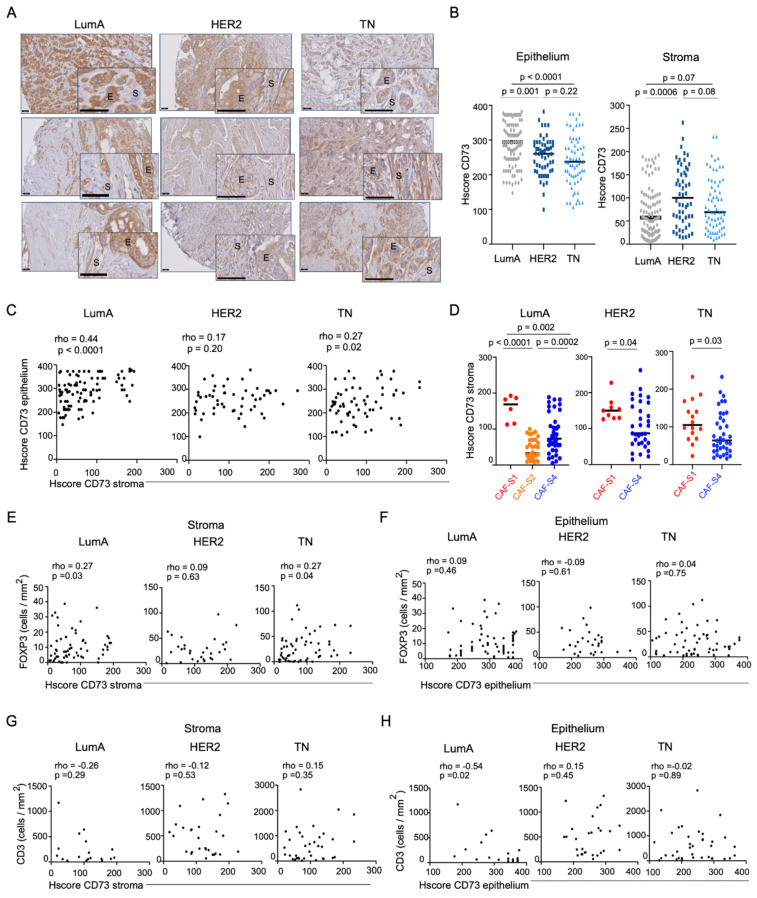
Figure 1.
CD73 protein level in stroma is associated with Tregs content. (A) Representative images of CD73 immunostaining in LumA (left), HER2 (middle), TNBC (right) in stroma (S) and epithelium (E). Three representative patients per BC subtype are shown. Scale bars, 50 µm; 25 µm (inset). (B) Histological scores (HScore) of CD73 assessed in epithelial cells (epithelium, left) or CAF (stroma, right). Each dot represents one tumor (n = 215), including LumA (n = 96), HER2 (n = 54) and TN (n = 65) BC. Hscore is calculated as follow: HScore = Intensity of the marker (0–4) × % of stained cells (0–100). Data are represented as median. p-values from Mann–Whitney test. (C) Correlation between CD73 Hscores in stroma and epithelium in LumA (n = 96), HER2 (n = 54) and TN (n = 65) BC. Correlation coefficients and p-values from Spearman’s test. (D) CD73 HScore in stroma in CAF-S1-, CAF-S2- or CAF-S4-enriched BC (as determined in [19]) in LumA (n = 80), HER2 (n = 42) and TN (n = 53) BC. Data are represented as median. p-values from Mann-Whitney test for LumA and TN BC, and unpaired t-test for HER2 BC. (E,F) Correlation between FOXP3+ T lymphocytes per mm2 and HScore of CD73 in stroma (E) and epithelium (F) of LumA (n = 63), HER2 (n = 30), and TN (n = 57) BC. Correlation coefficients and p-values from Spearman’s test. (G,H) Correlation between CD3+ T lymphocytes per mm2 and HScore of CD73 in stroma (G) and epithelium (H) of LumA (n = 18), HER2 (n = 28) and TNBC (n = 36) patients. Correlation coefficients and p-values from Spearman’s test.

