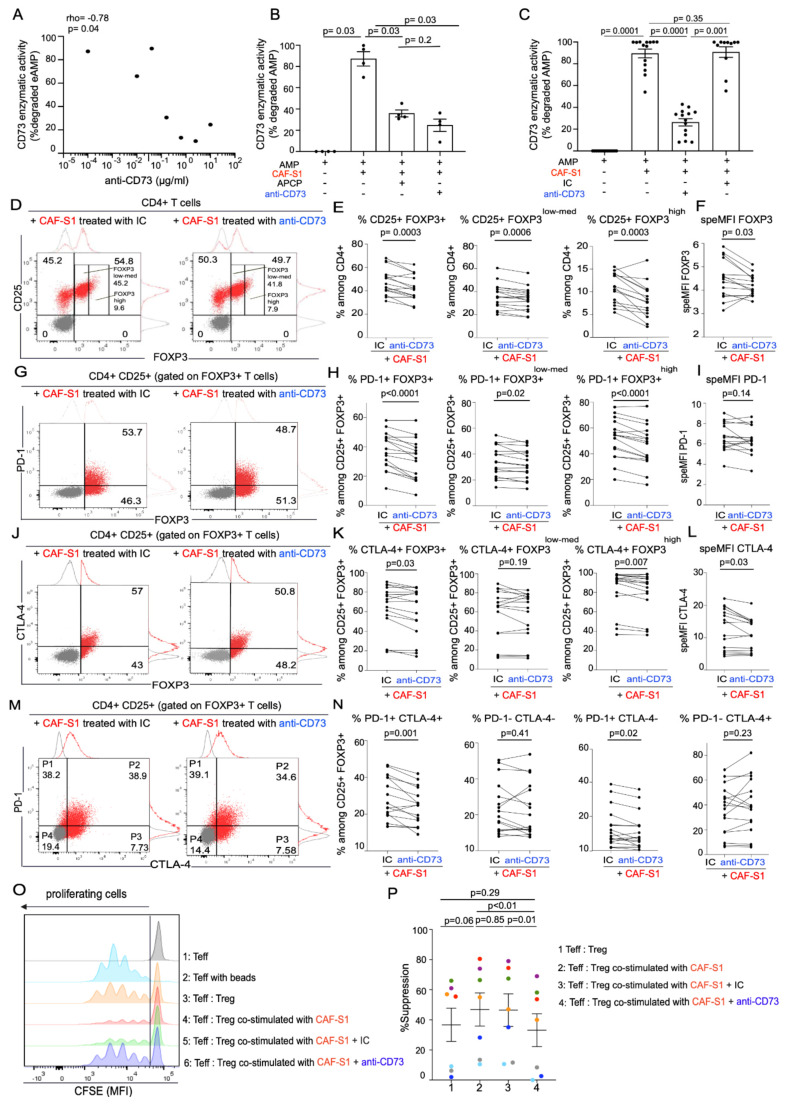
Figure 4.
Anti-CD73 antibody impairs CAF-S1 immunosuppressive activity. (A) Inverse correlation between CD73 enzymatic activity (assessed by % of degraded AMP = 100 − % residual AMP) in CAF-S1 and the different concentrations of anti-CD73 antibody tested, as indicated. Correlation coefficient and p-value from Spearman’s test (n = 4 independent experiments) (B) CD73 enzymatic activity in CAF-S1 in presence of the pharmacological inhibitor APCP (100 µM) and compared to monoclonal anti-CD73 antibody (at 10 µg/mL, as defined in (A)). % degraded AMP = (100 − % residual AMP) and % residual AMP = 100 × (relative luminescence unit in CAF-S1 (untreated, treated with APCP or anti-CD73 Ab)/relative luminescence unit of AMP alone). Each dot represents data from one primary CAF-S1 cell line (n = 4). Data are mean ± SEM. p-values from Mann–Whitney test (C) CD73 enzymatic activity in CAF-S1 in presence of isotype control (IC) and monoclonal anti-CD73 antibody (at 10 µg/mL, as defined in (A)). % degraded AMP = (100 − % residual AMP) and % residual AMP = 100 × (relative luminescence unit in CAF-S1 (untreated, treated with anti-CD73 Ab or with IC)/relative luminescence unit of AMP alone). Each dot represents data from one primary CAF-S1 cell line (n = 14). Data are mean ± SEM. p-values from Wilcoxon test. (D) Flow cytometry plots representing the proportion of CD25+ FOXP3+/- cells among CD4+ CD25+ T lymphocytes in presence of CAF-S1 pre-treated with IC (left) or with anti-CD73 antibody (right). Treatment of CAF-S1 with anti-CD73 Ab or IC antibodies (10 µg/mL) was performed for 24h before CAF-S1 co-culture with CD4+ CD25+ T lymphocytes. (E) Percentages (%) of CD25+ FOXP3+ (left), CD25+ FOXP3low-med (middle) and CD25+ FOXP3high (right) among CD4+ CD24+ T lymphocytes upon co-culture with CAF-S1 pre-treated with IC or with anti-CD73 Ab. Each dot represents one donor (n = 16). Five CAF-S1 independent primary cell lines tested. p-values from paired t-test. (F) FOXP3 speMFI among CD4+ CD25+ FOXP3+ T lymphocytes upon co-culture with CAF-S1 pre-treated with IC or with anti-CD73 Ab. Each dot represents one donor (n = 16). Five CAF-S1 independent primary cell lines tested. p-values from Wilcoxon test. (G) Same as (D) for PD-1+ among CD4+ CD25+ FOXP3+ T lymphocytes. (H) Same as (E) evaluating % of PD-1+ among CD4+ CD25+ FOXP3+ (left), CD25+ FOXP3low-med (middle) and CD25+ FOXP3high (right) upon co-culture with CAF-S1 pre-treated with IC or with anti-CD73 Ab (n = 16). p-values from paired t-test for % of PD-1+ among CD4+ CD25+ FOXP3+ and CD25+ FOXP3high. p-values from Wilcoxon test for % of PD-1+ among FOXP3low-med (I) Same as in (F) for PD-1 SpeMFI in CD4+ CD25+ FOXP3+ PD-1+ T cells. Each dot represents one donor (n = 16). Five CAF-S1 independent primary cell lines tested. p-values from Wilcoxon test. (J,K,L) Same as (G,H,I) evaluating % and SpeMFI of CTLA-4+ among CD4+ CD25+ FOXP3+ CTLA-4+ T lymphocytes (n = 16). Five CAF-S1 independent primary cell lines tested. p-values Wilcoxon test. (M) Same as in (D,G,J) for PD-1+ CTLA-4- (P1), PD-1+ CTLA4+ (P2), PD-1- CTLA-4+ (P3) and PD-1- CTLA-4- (P4) among CD4+ CD25+ FOXP3+ T lymphocytes. (N) Same as in (E,H,K) for PD-1+ CTLA-4+, PD-1- CTLA-4-, PD-1+ CTLA-4- and PD-1- CTLA-4+ T lymphocytes. Each dot represents one donor (n = 16). Five CAF-S1 independent primary cell lines tested. p-values from Wilcoxon test. (O) Representative CSFE fluorescent intensities quantifying CD4+ effector T cells (Teff) proliferation. Teff were incubated in presence of CD3/CD28 beads and Tregs (CD4+ CD25med CD128low CD45RAlow) (Treg: Teff ratio of 2:1), Tregs having been either pre-incubated with untreated CAF-S1 or with CAF-S1 pre-treated with IC (green) or with anti-CD73 Ab (blue). (P) Quantification of the percentage (%) of suppression of Teff proliferation by Tregs, calculated as follow: ((log2 (y) of Teff alone − log2(y) Teff + Treg)/(log2 (y) Teff alone)) × 100, where y corresponds to CFSE MFI in the whole population divided by CFSE MFI in non-proliferating cells. Data are means ± SEM. Each dot represents one donor (n = 5). Three CAF-S1 independent primary cell lines tested. p-values from paired t-test.

