Figure 2.

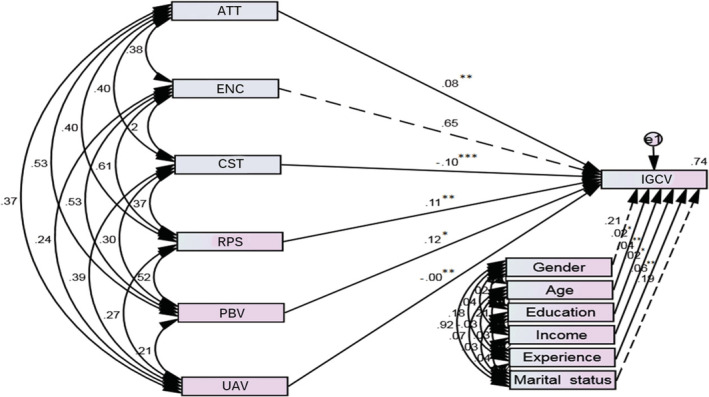
Path diagram of SEM. Significant and insignificant paths are indicated by continuous and dashed lines respectively. ***p < 0.00, **p < 0.01, *p < 0.05

Path diagram of SEM. Significant and insignificant paths are indicated by continuous and dashed lines respectively. ***p < 0.00, **p < 0.01, *p < 0.05