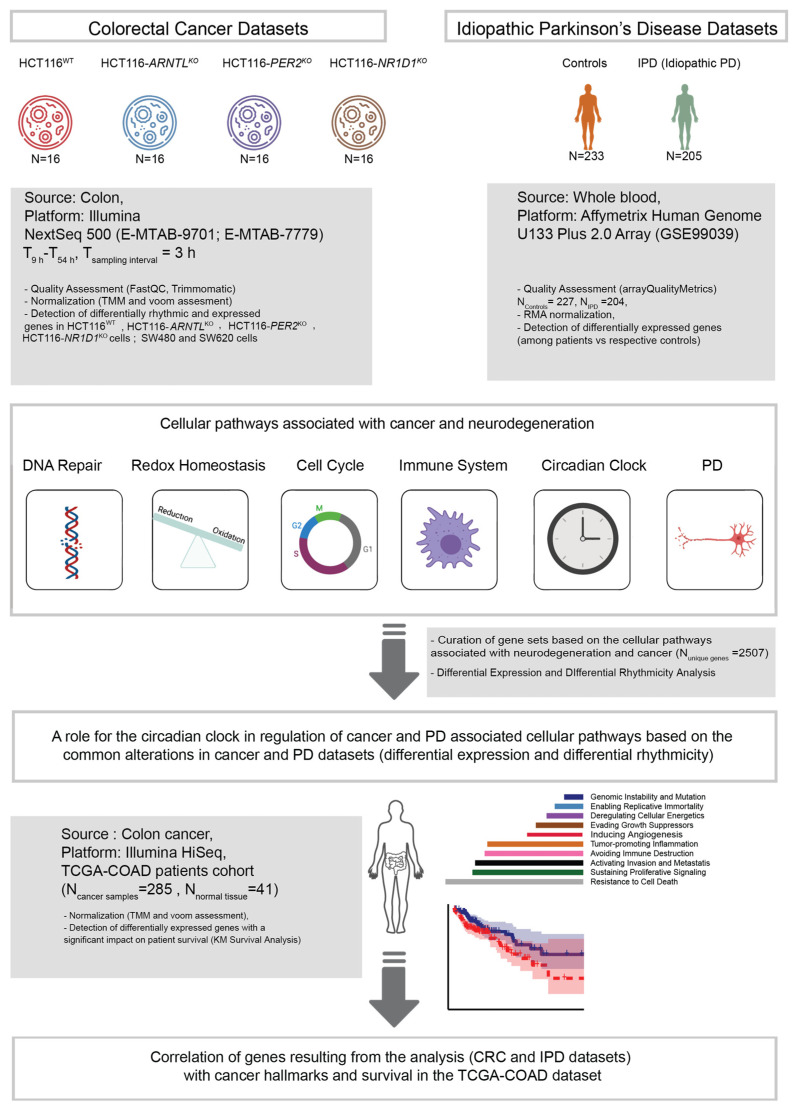
Figure 1.
Workflow for the analysis of time-series RNA-seq data sets from CRC cell lines and microarray data sets from a cohort of IPD patients. KO cells were derived from HCT116WT cells using CRISPR/Cas9 methodology. RNA-seq data sets (ArrayExpress: E-MTAB-9701) include the HCT116WT and three core-clock knockout cells (HCT116-ARNTLKO, HCT116-PER2KO and HCT116-NR1D1KO) sampled as indicated. Data sets of two additional CRC cell lines (SW480, SW620; ArrayExpress: E-MTAB-7779) were also included in the rhythmicity analysis as indicated. Following data pre-processing, circadian and ultradian rhythms were detected and differential rhythmicity analysis was performed. In addition, differential gene expression analysis was carried out for all expressed genes as compared to the corresponding controls, for HCT116 cells and IPD data sets (GEO: GSE99039).

