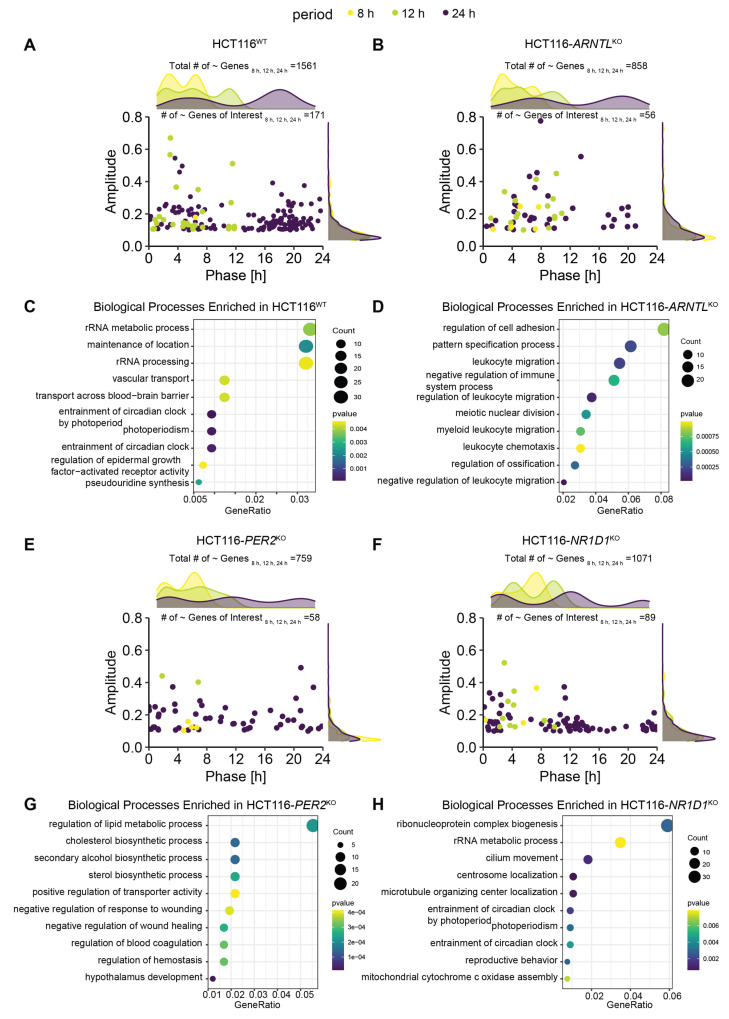
Figure 2.
Core-clock KO affects the rhythmic characteristics of expressed genes in HCT116 cells and the associated biological processes. (A) Acrophase and amplitude distribution of significantly oscillating genes (based on RAIN q < 0.05 and relative amplitude ≥ 0.1) in HCT116WT cells (Ntotal~8 h,12 h,24 h = 1561,Ntotal24 h~genes = 1241, Ntotal12 h~genes = 273, Ntotal8 h~genes = 46; NtotalGenesofInterest~8 h,12 h,24 h = 171, N24 h~GenesofInterest = 143, N12 h~GenesofInterest = 27 and N8 h~GenesofInterest = 1), (B) Acrophase and amplitude distribution of significantly oscillating genes in HCT116-ARNTLKO (Ntotal~8 h,12 h,24 h = 858, Ntotal24 h~genes = 459, Ntotal12 h~genes = 321, Ntotal8 h~genes = 78; NtotalGenesofInterest~8 h,12 h,24 h = 56, N24 h~GenesofInterest = 35, N12 h~GenesofInterest = 16; N8 h~GenesofInterest = 5), (C) Top 10 GO (Biological Processes) enrichment results of 24 h rhythmic genes in HCT116WT cells (D) Top 10 GO (Biological Processes) enrichment results for 24-h rhythmic genes in HCT116-ARNTLKO (E) Acrophase and amplitude distribution of significantly oscillating genes in HCT116-PER2KO (Ntotal~8 h,12 h,24 h = 759, Ntotal24 h~genes = 539, Ntotal12 h~genes = 179, Ntotal8 h~genes = 41; NtotalGenesofInterest~8 h,12 h,24 h = 58, N24 h~GenesofInterest = 52, N12 h~GenesofInterest = 2; N8 h~GenesofInterest = 4) (F) Acrophase and amplitude distribution of significantly oscillating genes in HCT116-NR1D1KO (Ntotal~8 h,12 h,24 h = 1071, Ntotal24 h~genes = 884, Ntotal12 h~genes = 152, Ntotal8 h~genes = 35; NtotalGenesofInterest~8 h,12 h,24 h = 89, N24 h~GenesofInterest = 76, N12 h~GenesofInterest = 10 and N8 h~GenesofInterest = 3) (G) Top 10 GO (Biological Processes) enrichment results for 24-h oscillating genes in HCT116-PER2KO (H) Top 10 GO (Biological Processes) enrichment results for 24-h oscillating genes in HCT116-NR1D1KO. Density plots on top panels indicate total number of oscillating genes. Number of oscillating genes of interest (for 8 h, 12 h, and 24 h periods) and total number of oscillating genes (for 8 h, 12 h, and 24 h periods) indicated above each panel. Pre-selected genes of interest are visualized in the scatter plots. The genes oscillating with different periods are colour coded (24 h~, purple; 12 h~, green; 8 h~, yellow). “~” stands for significantly oscillating genes.

