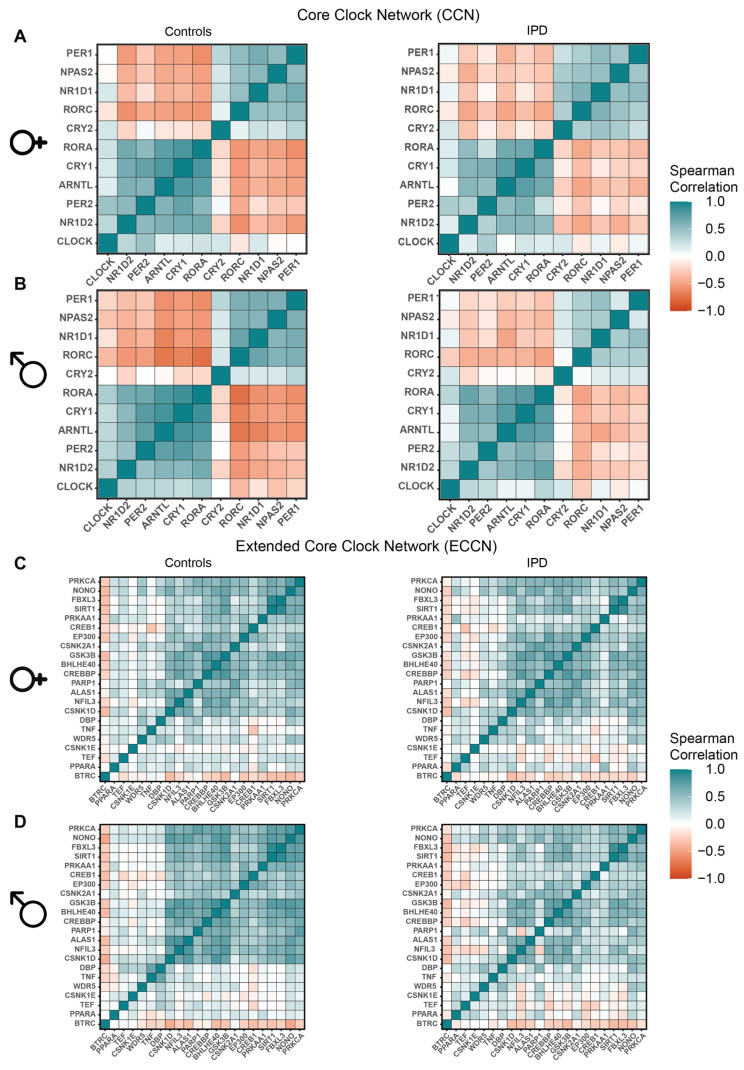
Figure 6.
Correlation heatmaps of CCN and ECCN genes in IPD patients versus controls (sex separated). (A,B) Heatmap visualization of Spearman correlation between CCN genes in IPD, as well as the controls for (A) females and (B) males. (C,D) Heatmap visualization of Spearman correlation between each pair of the ECCN genes in IPD as well as in the control group for (C) females and (D) males.

