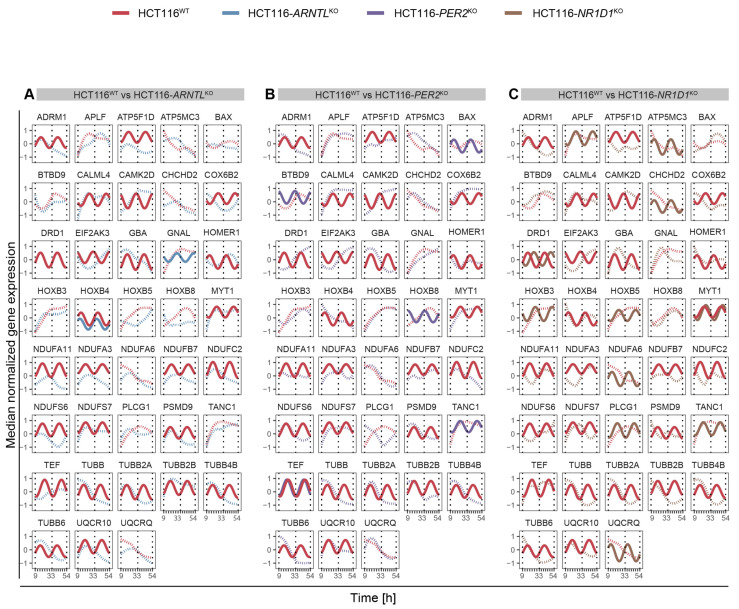
Figure 7.
Circadian expression profiles of PD-associated genes. (A) in HCT116WT and HCT116-ARNTLKO (B) in HCT116WT and HCT116-PER2KO (C) in HCT116WT and HCT116-NR1D1KO. Rhythmicity analysis was computed considering a 24-h period. Depicted are significantly rhythmic genes (q < 0.05 and relative amplitude ≥ 0.1) plotted using a harmonic regression fitting (full lines), whereas not significantly rhythmic genes were represented with LOESS (dashed lines) (see Figure S3 for similar analysis in SW480 and SW620 cells).

