Figure 8.
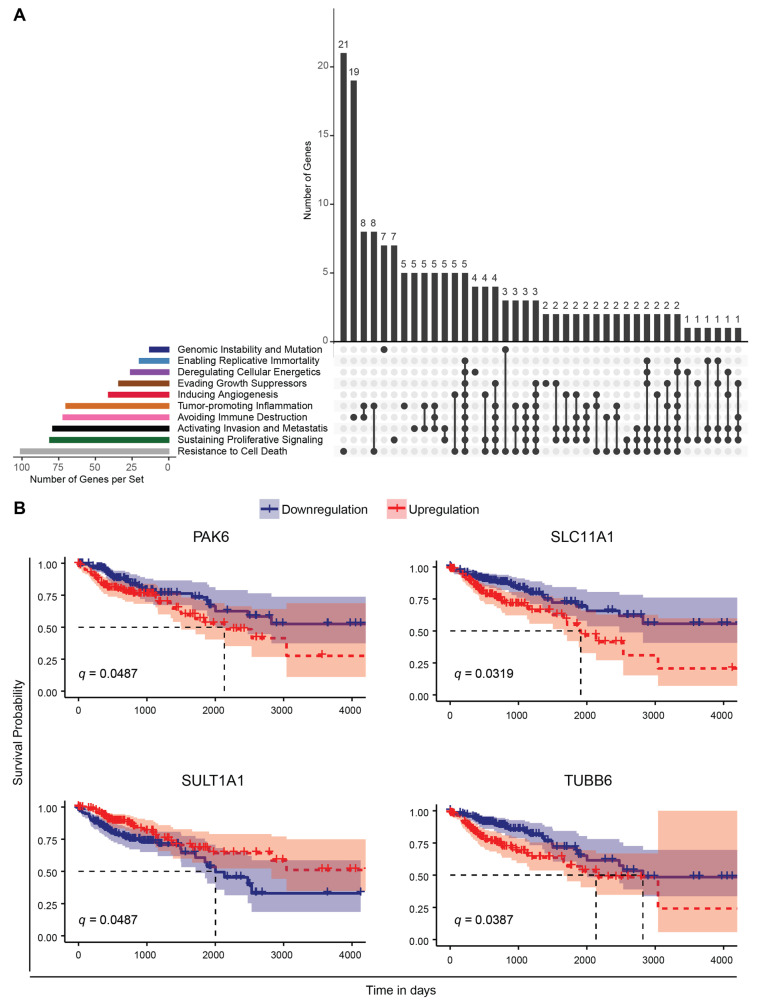
Correlation of genes resulting from the analysis with CRC cell lines and the cohort of IPD patients, with cancer hallmarks and survival in a colon adenocarcinoma cohort. (A) The plot depicts the intersection of cancer-hallmarks-related genes (retrieved from the CHG database [56]) and relevant genes highlighted by our analysis (Table S11). The colour coded bar plots (left) indicate the number of genes related to a particular cancer hallmark. The genes found to be associated with more than one hallmark are indicated with connecting lines (right). The number of unique genes and genes associated with more than one cancer hallmark are indicated above the grey bar plots (right). (B) Kaplan–Meier survival curves for genes found to be common in our analysis and genes associated with patient survival in the TCGA-COAD cohort. The patient cohort was separated into two groups based on the median gene expression level as high and low expression groups and a comparison of survival time (in days) was performed. In a subsequent analysis, using cancer stage as stratification of the patients, the following q-values were obtained: PAK6, q = 0.036; SLC11A1, q = 0.005; SULT1A1, q = 0.27; TUBB6, q = 0.01 (see also Table S12).

