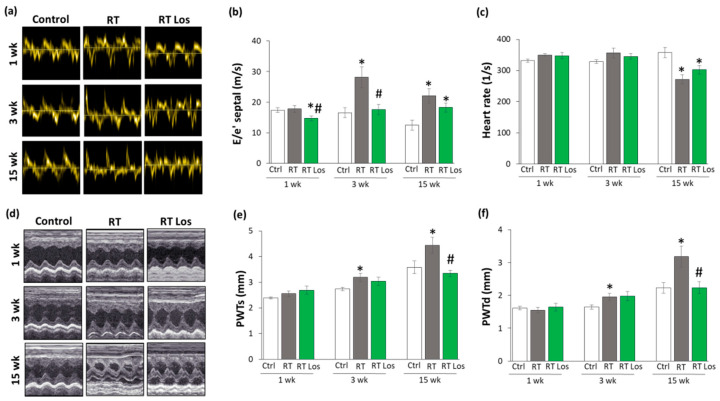
Figure 2.
The effects of losartan on the echocardiographic parameters at weeks 1, 3, and 15. (a) Representative tissue Doppler images of diastolic septal mitral annulus velocity e’, (b) mitral valve early flow velocity (E)/ e’, (c) heart rate, (d) representative M-mode images of wall thicknesses and left ventricular diameters, (e) posterior wall thicknesses in systole (PWTs) and (f) diastole (PWTd). Values are presented as mean ± S.E.M., * p < 0.05 vs. control group, # p < 0.05 vs. RT only group (n = 6–7, One-Way ANOVA, Holm-Sidak post hoc test). Ctrl: control group, RT: radiotherapy only group (50 Gy), RT Los: RT plus losartan group. Representative M-mode images were saved from the Echo- Pac Dimension v201 software.

