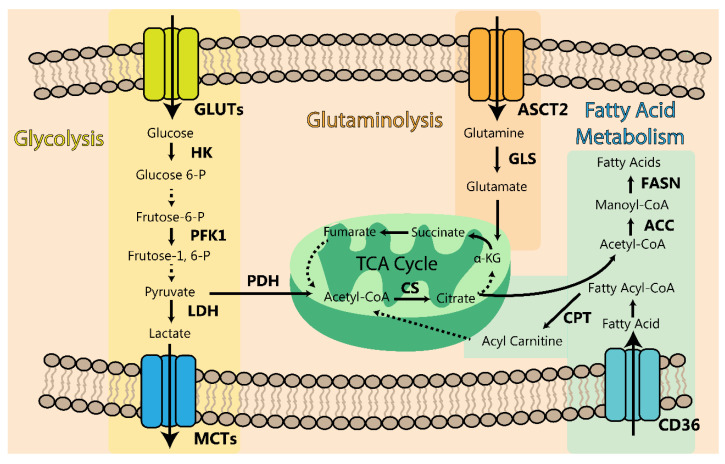
Figure 7.
Schematic representation of the discussed metabolic pathways in PDAC. The glycolytic pathway (yellow shade), glutaminolysis (orange shade), and the fatty acid metabolism (blue shade) are represented. The enzymes and transporters (bold) are the key intermediated targets which can be envisaged for new promising therapeutic strategies. Dashed arrows indicate more reactions not explored in the review. Legend: glucose transporters (GLUT1 and GLUT3), hexokinase (HK), phosphofructokinase 1 (PFK1), pyruvate dehydrogenase (PHD), lactate dehydrogenase (LDH), monocarboxylate transporters (MCT4 and MCT1), fatty acid transporter CD36, fatty-acid synthase (FASN), acetyl-CoA carboxylase (ACC), carnitine palmitoyl transferase (CPT), citrate synthetase (CS), ASCT2 (glutamine transporter) and glutaminase (GLS).

