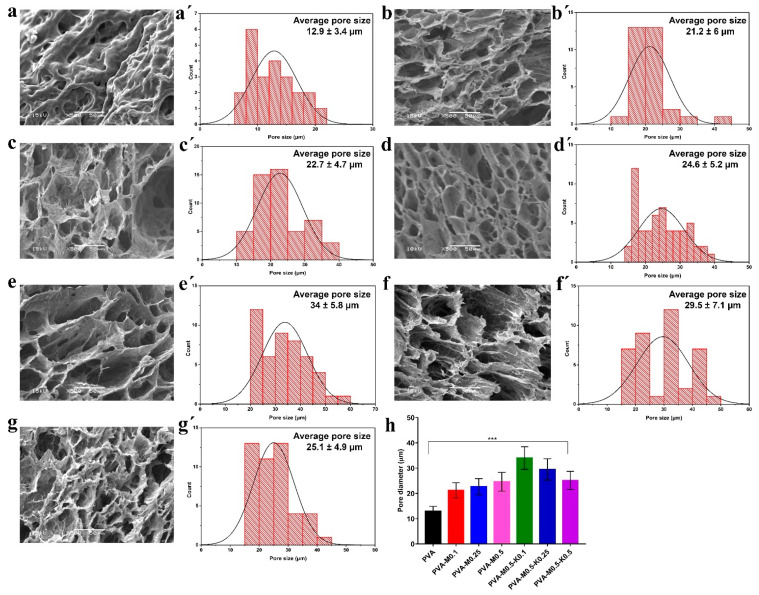
Figure 4.
SEM images show cross-sectional and porous structures (a) PVA, (b) PVA-M0.1, (c) PVA-M0.25, (d) PVA-M0.5, (e) PVA-M0.5-K0.1, (f) PVA-M0.5-K0.25, and (g) PVA-M0.5-K0.5 composite sponges at a magnification of 500×. (a’–g’) illustrates the pore size distribution of PVA, PVA-M0.1, PVA-M0.25, PVA-M0.5, PVA-M0.5-K0.1, PVA-M0.5-K0.25, and PVA-M0.5-K0.5 composite sponges, respectively. (h) indicates the size of the average pores of PVA, PVA/marjoram, and PVA/marjoram/kaolin sponges. Results are presented as means ± SD (*** p < 0.001).

