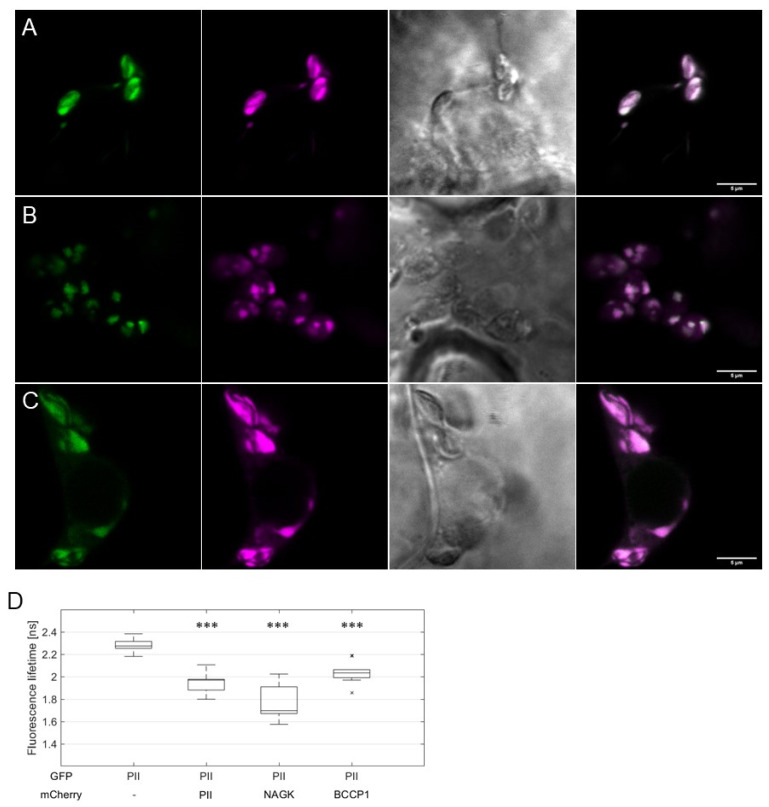
Figure 4.
FRET/FLIM analysis of AtPII interaction with candidate proteins in PII foci. AtPII-GFP was co-expressed with AtPII-mCherry (A), AtNAGK-mCherry (B), and AtBCCP1-mCherry (C), respectively, under the control of p35S promotor in N. benthamiana using 2in1 FRET vectors. Images were taken 2 days after transient transformation of N. benthamiana. In each row, the fluorescence of GFP is shown first, mCherry (magenta) is shown second, the brightfield image is shown third, and the merge of both fluorescence pictures is shown is shown last. Scale bar: 10 µm. (D) FLIM analyses of fluorescent co-localising signals in (A–C). Student’s t-test used for calculation of significance. Data points marked with an “x” represent statistical outliers of measurement. *** p < 0.001.

