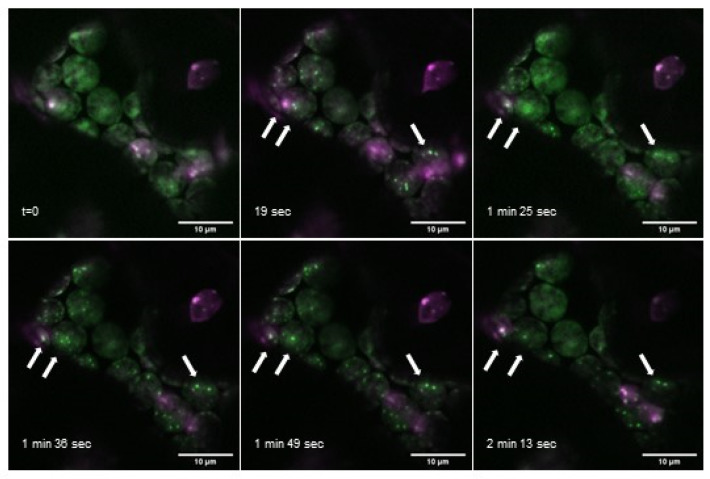
Figure 5.
Appearance of PII foci over time. Overlay images of time series of AtPII-GFP (green) and AtNAGK-mCherry (magenta), both expressed under the control of p35S, 2 days after transient transformation of N. benthamiana. White arrows mark exemplarily PII foci observable over the whole time range. Scale bar: 10 µm.

