Figure 7.
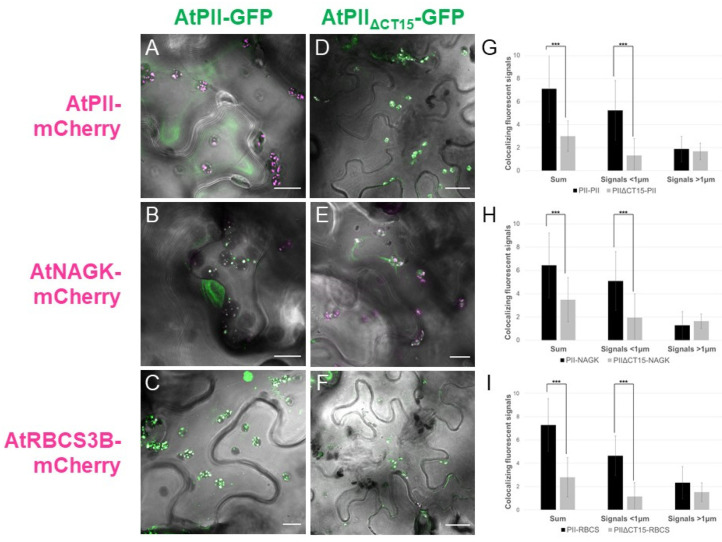
Truncation of the C-terminus of AtPII leads to different aggregation behavior. AtPII-GFP or AtPIIΔCT15-GFP were co-expressed either with AtPII-mCherry ((A,D), respectively), AtNAGK-mCherry ((B,E), respectively) or AtRBCS3B- mCherry ((C,F), respectively), under the control of p35S in N. benthamiana. Each of these pictures shows the merge of GFP and mCherry fluorescence with the brightfield image as background. Size bars show 10µm except for (D) and (F) where they indicate 22 µm. In G-I, the average total number (Sum) and the number of small and large co-localizing fluorescent signals per chloroplast for the co-expressions of AtPII-GFP/AtPIIΔCT15-GFP + AtPII-mCherry (G), + AtNAGK-mCherry (H), and AtRBCS3B-mCherry (I) are provided (n = 25). Student’s t-test used for calculation of significance. *** p < 0.001.

