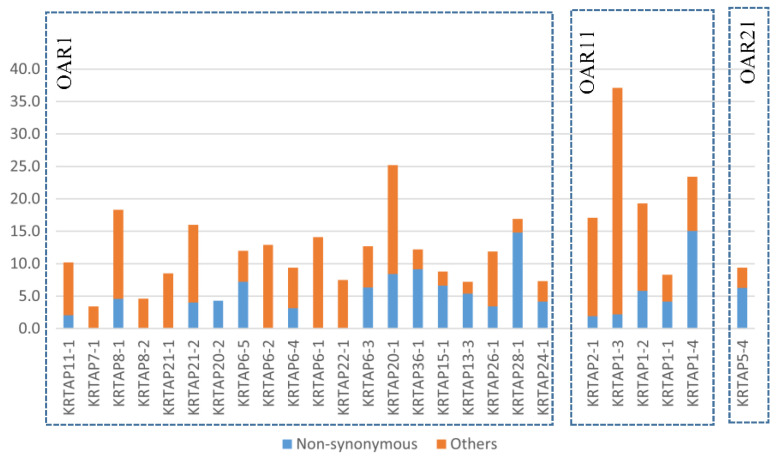
Figure 3.
Density of SNPs in selected ovine KRTAPs. The density is expressed as the number of SNPs per kilobase. The order of KRTAPs on the x-axis represents their relative location on the chromosomes 1, 11, and 21. The SNPs are divided into non-synonymous SNPs (in blue) and others (including synonymous SNPs in the coding region and SNPs in the flanking regions).

