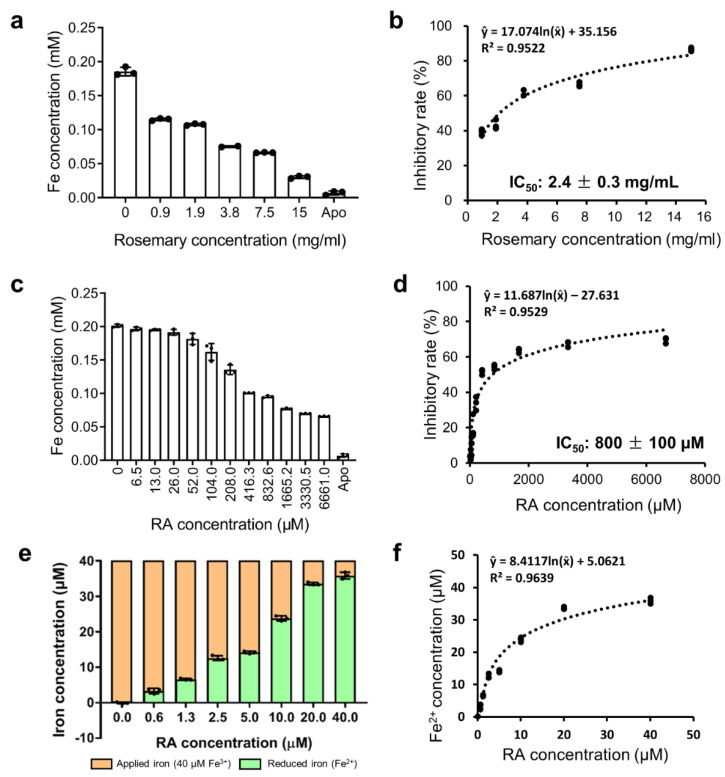
Figure 2.
(a) The remaining Fe concentrations in the eluents after inhibition assays using rosemary extracts. (b) Inhibitory rates of rosemary extracts. A nonlinear regression model was performed to fit the concentration (rosemary)—response (inhibitory rate) data. (c) The remaining Fe concentrations in the eluents after inhibition assay using RA. (d) Inhibitory rates of RA. A nonlinear regression model was performed to fit the concentration (RA)—response (inhibitory rate) data. (e) The reduced Fe2+ concentration after adding RA (0, 0.6, 1.3, 2.5, 5, 10, 20, and 40 μM). Orange bar, applied Fe3+ (40 μM). Green bar, reduced Fe2+ from Fe3+ by RA. (f) A nonlinear regression curve fitting of the concentration (RA)—response (Fe2+) data.

