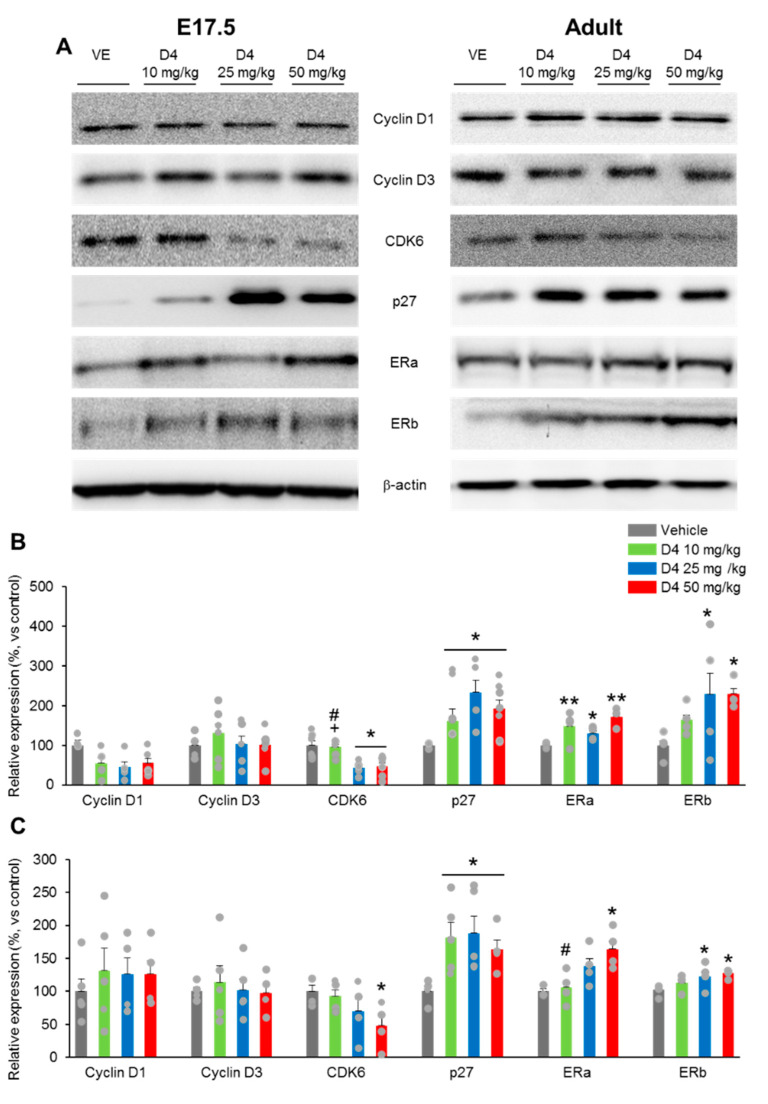
Figure 6.
Prenatal D4 regulated cell cycle regulatory protein and estrogen receptor expression in neural progenitor cells. (A) Cell cycle regulatory protein content were analyzed by using Western blotting (β-actin as loading control). (B,C) Quantification of (A). (B) At E17.5, D4 25 mg/kg and 50 mg/kg groups showed significant decreases in CDK6 compared to both vehicle and D4 50 mg/kg groups (F3,22 = 8.886, p = 0.0007). Moreover, compared to vehicle group, D4-treated groups exhibited increases in p27 (F3,22 = 3.374, p = 0.0465). n = 5–7 per group. (C) At adult stage, D4 50 mg/kg groups showed decreased in CDK6 (F3,20 = 3.318, p = 0.0418). p27 was markedly higher in the D4-treated groups (F3,20 = 11.39, p = 0.0002). D4-treated groups showed increases in ERa at both E17.5 (F3,27 = 9.612, p = 0.0002) and adult stage (F3,22 = 5.194, p = 0.0177). However, compared to vehicle groups, D4 25 mg/kg and 50 mg/kg group exhibited increases in ERb E17.5; F3,29 = 4.406, p = 0.0124; adult; F3,27 = 5.218, p = 0.0065). n = 5 per group. Data represent mean ± SEM. Statistical significance was determined by one-way ANOVA with Bonferroni correction. * p < 0.05 vs. vehicle, ** p < 0.01 vs. vehicle, # p < 0.05 D4 10 mg/kg vs. D4 50 mg/kg, + p < 0.05 D4 25 mg/kg vs. D4 50 mg/kg.

