
Figure 3.
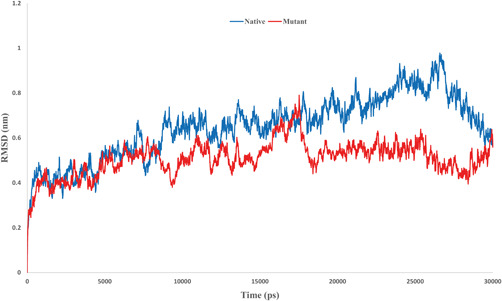
Root‐mean‐square deviation (RMSD) curve for the native and mutant spike, after 18 ns, the amount of conformational shift in both systems has been minimized
Official websites use .gov
A
.gov website belongs to an official
government organization in the United States.
Secure .gov websites use HTTPS
A lock (
) or https:// means you've safely
connected to the .gov website. Share sensitive
information only on official, secure websites.
Root‐mean‐square deviation (RMSD) curve for the native and mutant spike, after 18 ns, the amount of conformational shift in both systems has been minimized