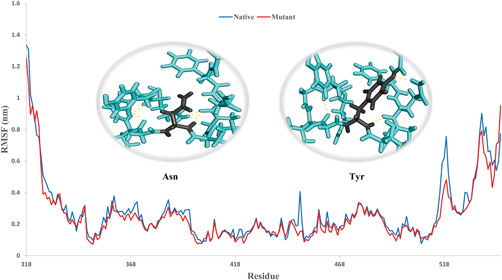
Figure 4.

Root‐mean‐square fluctuation (RMSF) diagram, the higher number of polar interactions in the mutant compared to the native spike (4 vs. 2) reduces the structural fluctuations rate following the N501Y mutation

Root‐mean‐square fluctuation (RMSF) diagram, the higher number of polar interactions in the mutant compared to the native spike (4 vs. 2) reduces the structural fluctuations rate following the N501Y mutation