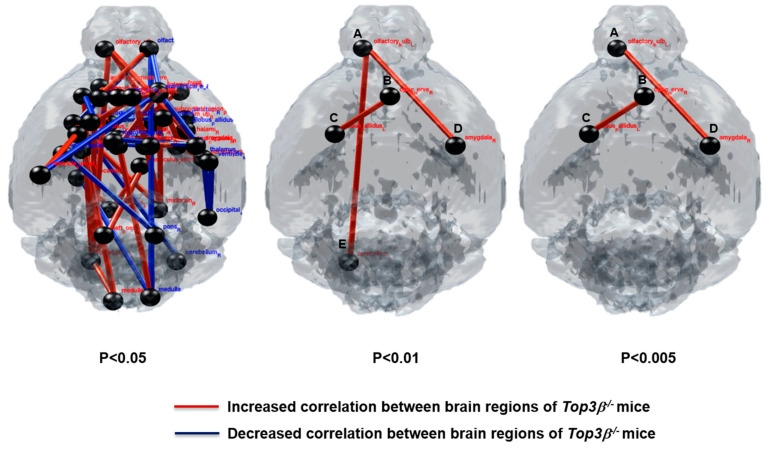
Figure 7.
Functional correlation map in different regions of Top3β−/− mice brains by PET/CT image analysis. Metabolic correlation in brains of Top3β−/− mice was determined from (18F-FDG) PET analysis. Top3β−/− mice showed altered metabolic correlation in different nodes of brain regions. Red lines and blue lines indicate increased and decreased correlations between two brain regions of 53 VOIs, respectively (p < 0.005, p < 0.01, and p < 0.05 vs. WT mice, n = 7 mice per group). A; olfactory bulb, B; optic nerve, C; globus pallidus, D; amygdala, E; cerebellum. L; left, R; right.

