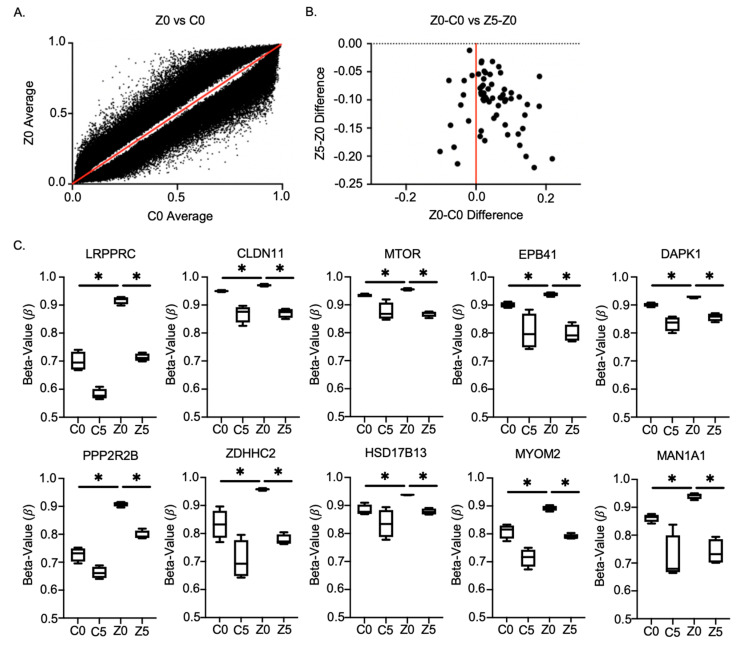
Figure 6.
DNA methylation chip analysis of Zeb1KD PC-3 prostate cancer cells identified 10 genes associated with a p-EMT phenotype. DNA was extracted from PC-3 Zeb1KD (Zeb1 knockdown) cells with doxycycline (Dox) treated with dimethyl sulfoxide (DMSO) (Z0) or 5-azacitadine (5-aza; Z5; 5µM), and from Dox-induced control (ctrl) cells treated with DMSO (C0) or 5-aza (C5; 5 µM) and was assessed for global changes in DNA methylation using an Infinium Methylation EPIC chip. (A) A two-tailed, unpaired, equal variance t-test was completed with FDR cut-off value = 0.05 (Benjamini-Hochberg FDR) between C0 and Z0. This was filtered for significant Z0-C0 differences, and 107,971 cg sites were observed. (B) A two-tailed, unpaired, equal variance t-test was completed with FDR cut-off value = 0.05 (Benjamini-Hochberg FDR) between Z0 vs. Z5. This was filtered for significant Z0-Z5 differences, and 62 cg sites were observed. Among the C0-Z0 and Z0-Z5 significant differences, we wanted to identify rescue changes, so we filtered the dataset for cg sites where Z0-C0 = -(Z5-Z0) and identified 51 cg sites (right side of graph (B)). (C) Genes identified in DNA methylation chip analysis (increased DNA methylation from C0 versus Z0 with a corresponding demethylation in Z5). β-value represents the estimate of DNA methylation level at a given locus. Data is presented as the mean ± standard error of the mean (SEM) (n = 4). * = significant difference between conditions.

