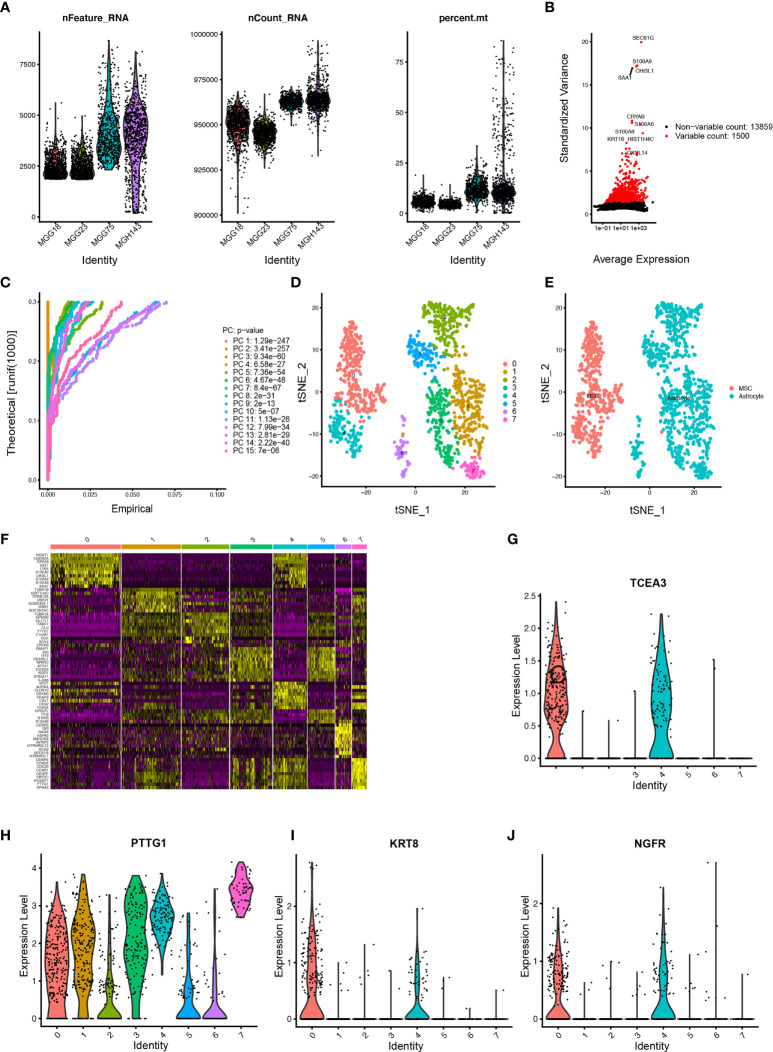
Figure 7.
Estimation of tumor-infiltrating cells for GBM subtypes based on scRNA-seq data (A) After quality control of the 3,483 cells from the tumor cores of 4 human GBM samples, 1,190 cells were included in the analysis. (B) The variance diagram shows 13,859 corresponding genes throughout all cells from GBMs. The red dots represent highly variable genes, and the black dots represent nonvariable genes. The top 10 most variable genes are marked in the plot. (C) PCA identified the 15 PCs with an estimated p value < 0.05. (D) All eight clusters of cells in GBMs were annotated by singleR and CellMarker according to the composition of the marker genes. (E) The tSNE algorithm was applied for dimensionality reduction with the 20 PCs, and 8 cell clusters were successfully classified. (F) The differential analysis identified 4,210 marker genes. The top 20 marker genes of each cell cluster are displayed in the heatmap. A total of 68 genes are listed beside of the heatmap after omitting the same top marker genes among clusters. The colors from purple to yellow indicate the gene expression levels from low to high. (G–J) Expression profiles of the four risk genes in eight cell clusters.

