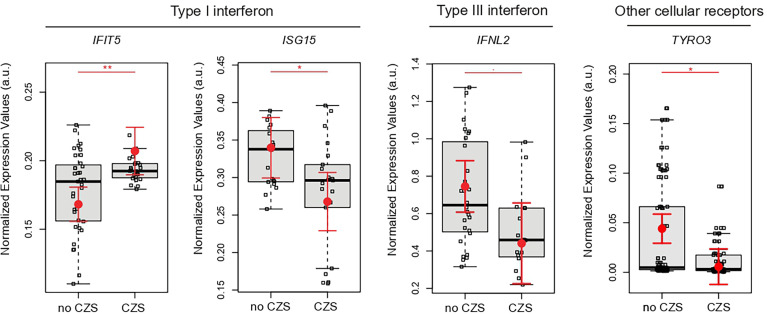
Figure 3.
Placental gene expression associated with CZS. Detailed graphs of differentially expressed genes in placenta without CZS (No CZS; N = 45) or with CZS (CZS; N = 29). Each dot corresponds to one placenta analyzed. The number of dots varies according to gene analyzed due to failed amplifications. Median and standard deviation of gene expression values are normalized by housekeeping genes selected by geNorm and NormFinder as well as 18S ribosomal RNA and RLP13 ribosomal protein L13 (grey boxes). Values are adjusted by mothers’ age (below or equal to/above 40 years of age) and infection trimester (trimester of pregnancy in which the first Zika symptoms occur or asymptomatic ZIKV infections). P-values ** ≤ 0.01, * ≤ 0.05, and ≤0.1.

