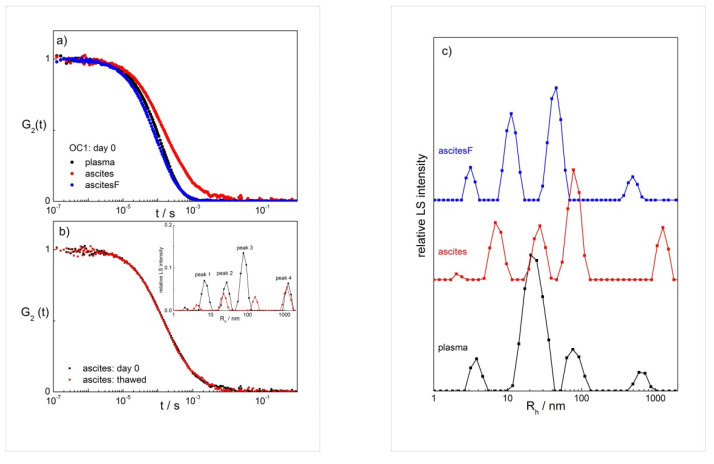
Figure 1.
(a) The normalized intensity correlation functions (G2(t)) of plasma, ascites, and filtered ascites (ascitesF) measured on the day of sampling (day 0) at θ = 90° and T = 25 °C; (b) the effect of freezing/thawing on G2(t) and the calculated distributions of the hydrodynamic radii (Rh) of particles in ascites (see inset); (c) the intensity weighted distributions of the hydrodynamic radii (Rh) of particles in plasma and both ascites samples. All data are for ovarian cancer patient OC1. The distributions are calculated by considering the viscosity of water at 25 °C (ηo = 0.9 mPa s−1).

