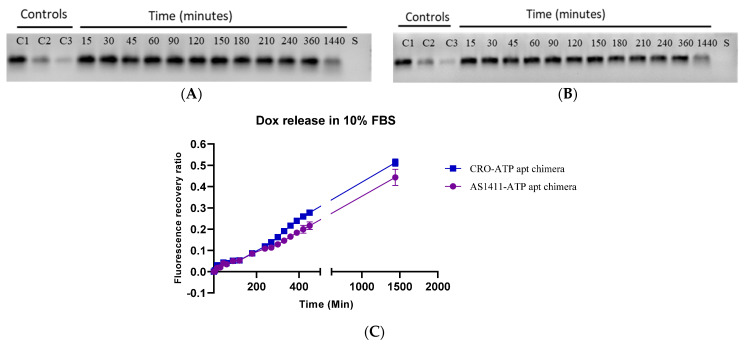
Figure 5.
Serum stability assay of the generated chimeras. (A) Serum stability of AS1411–ATP chimera on gel electrophoresis. (B) Serum stability of CRO–ATP chimera on gel electrophoresis. The bands of chimera are shown in black in 2% agarose gel. The numbers at the top indicate the time of incubation with serum in minutes. C1 = 1 µg of chimera, C2 = 0.5 µg and C3 = 0.25 µg used as control, S = serum blank. (C) Fluorescence recovery ratio of doxorubicin from both chimeras after incubation with 10% FBS.

