
Figure 2.
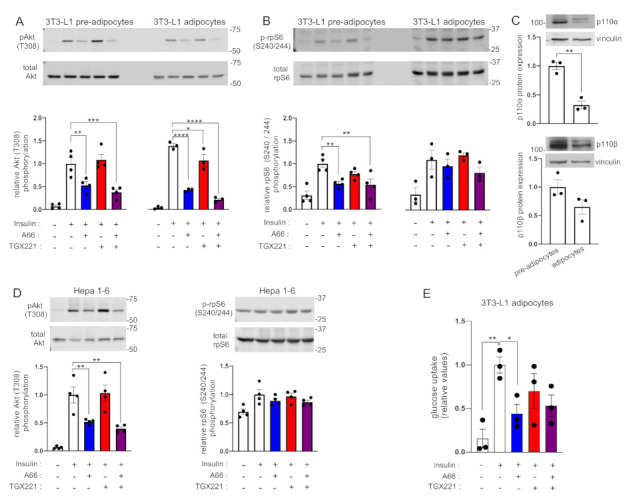
p110α is the principal PI3K isoform engaged in insulin signalling in 3T3-L1 adipocytes and Hepa 1.6 cells. 3T3-L1 pre-adipocytes or differentiated adipocytes or murine Hepa 1.6 hepatocytes were treated with A66 (1 μM, blue graph bars) or TGX221 (0.5 μM, red graph bars) or a combination of both inhibitors (purple graph bars) followed by stimulation with 100 nM of insulin for 15 min at 37 °C. (A) Levels of Akt (T308) phosphorylation in 3T3-L1 pre-adipocytes and adipocytes were determined by immunoblot analysis. Phosphorylation levels were normalised to total Akt levels detected in a second blot performed in parallel using the same lysates. (B) Ribosomal protein S6 (rpS6) phosphorylation (S240/244) was also detected in the same immunoblots. (C) The levels of expression of p110α and p110β in pre-adipocytes and differentiated 3T3-L1 adipocytes used for the signalling experiments were also determined by immunoblot analysis. (D) Akt (T308) and rpS6 (S240/244) phosphorylation in Hepa 1-6 murine hepatoma cells treated and stimulated as above. Representative immunoblots and bar graphs with pooled data from three or four (n = 3–4) independent experiments are shown. Data are presented as mean ± SEM. (E) Insulin-stimulated glucose uptake in 3T3-L1 adipocytes treated with inhibitors as above. Data from three (n = 3) independent experiments are shown. Statistical analysis was performed by one-way ANOVA with Dunnett’s multiple comparisons test between insulin-stimulated vehicle-treated and insulin-stimulated inhibitor-treated samples (A,B,D,E) or by unpaired two-tailed t-test (C). * p < 0.05; ** p < 0.01; *** p < 0.001; **** p < 0.0001.