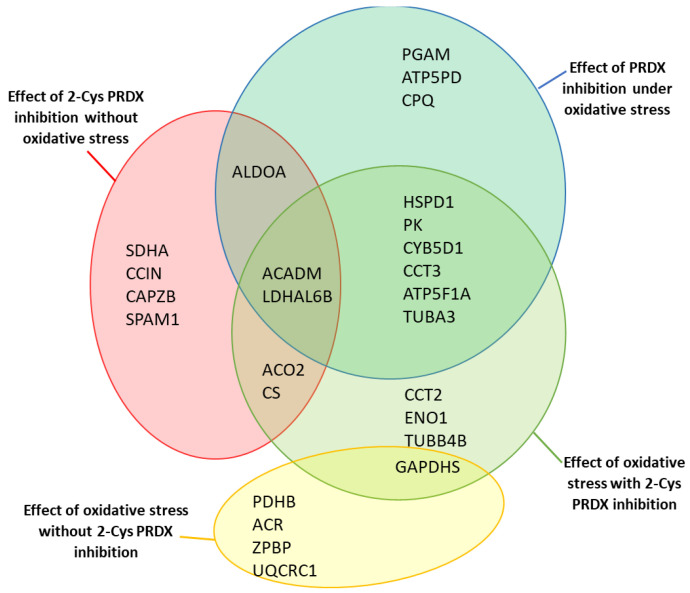
Figure 7.
Diagrams showing the identified proteins that showed redox changes under different experi-mental conditions. Proteins with changed levels of oxPTMs due to 2-Cys PRDX inhibition without oxidative stress are marked by the red circle; proteins with changed levels of oxPTM due to 2-Cys PRDX inhibition under oxidative stress (100 µM menadione) are marked by the green circle; proteins with altered levels of oxPTM due to oxidative stress with inhibition of 2-Cys PRDX (100 µM Con A) are marked by the blue circle; proteins with altered levels of oxPTM due to oxidative stress without 2-Cys PRDX inhibition are marked by the yellow circle.

