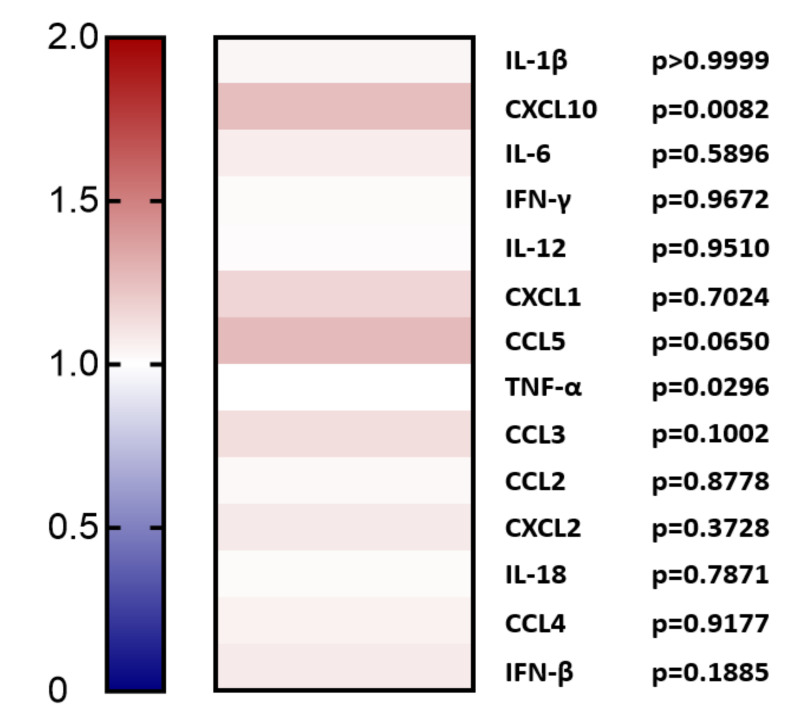
Figure 4.
Heat map analysis of the expression of cytokines in the plasma of mice over-expressing PCSK9 in vivo in comparison to control mice. The expression of inflammatory cytokines was measured using the Luminex assay in the plasma of the PCSK9 over-expressing mice (n = 8) and compared to the control mice (n = 8). Data are represented in the form of fold change for upregulated and downregulated cytokines with respect to the control mice. Mann–Whitney test was performed to analyze the disparities between the groups, and the groups with p < 0.05 were considered significantly different.

