Figure 8.
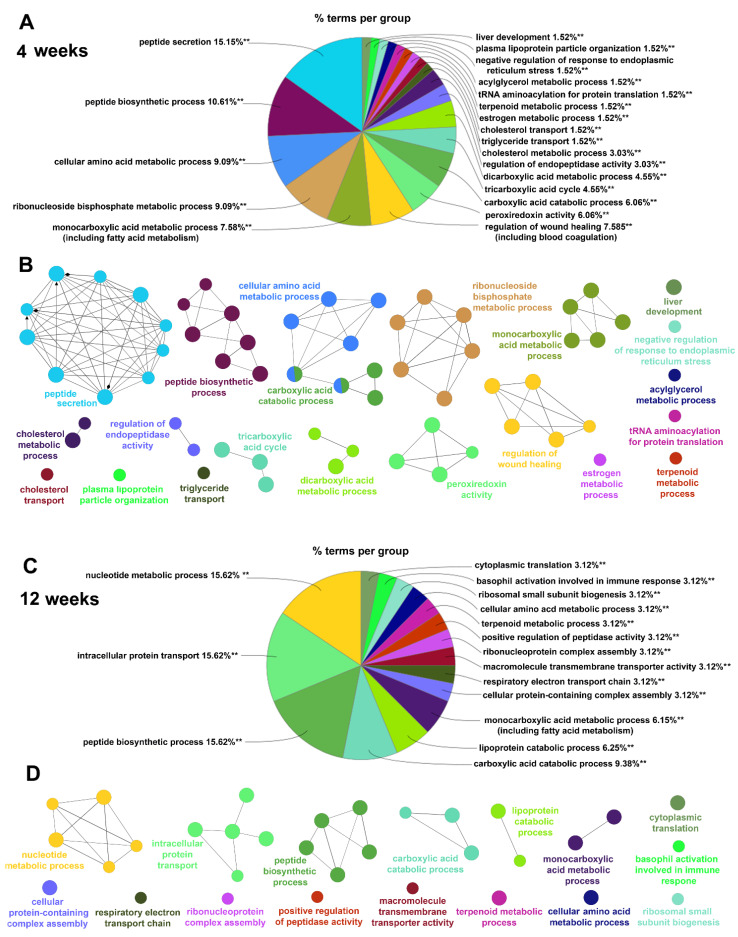
Functional analysis of S-palmitoylated proteins affected by the HPD diet after 4 and 12 weeks of feeding using the ClueGO algorithm. This is a continuation of the analysis shown in Figure 7 conducted for proteins whose S-palmitoylation extent was up- or downregulated by the HPD diet (the HPDpalm/RDpalm ratio ≥ 1.5 or ≤ 0.67). (A,C) Pie charts showing the percentage of enriched GO-BP terms of the total 66 terms for 4-week livers (A) and 32 terms for 12-week livers (C). Terms represented as pie slices are shown in Figure 7 with the same color coding. (B,D) Networks depicting interactions between enriched functional terms in indicated clusters are color-coded as in (A,C). Each circle represents a biological term, its size reflects the statistical significance of the term enrichment in S-palmitoylated proteins while the thickness of lines connecting the circles (connectivity) is derived from the kappa score and indicates the extent of similarity of genes common to the connected terms. Diamonds and arrowheads indicate regulation and positive regulation of relationship between the nodes, respectively (see the “peptide secretion” cluster in Figure 7A for details). For clarity, only the most significantly enriched term in each cluster is named. ** p < 0.005.

