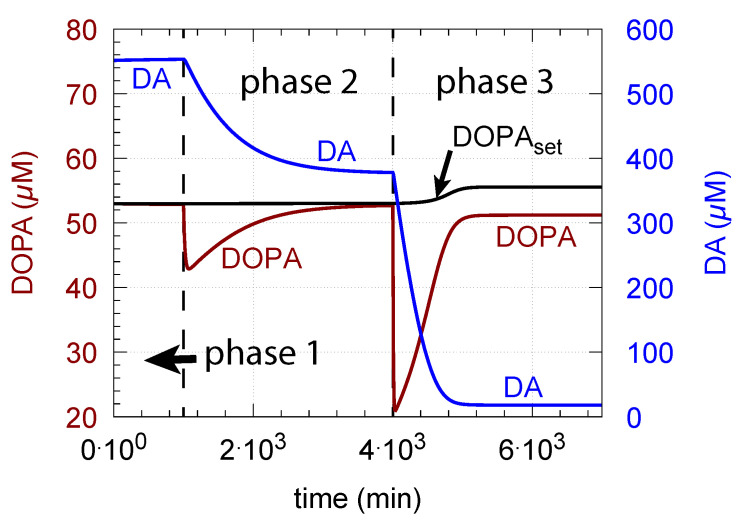
Figure 8.
Increase in leads to a poorer homeostatic regulation of DOPA due to TH inhibition by increased Tyr levels. The graph shows DOPA and DA concentrations when = 100 M/min. Other rate constant values as in Figure 6c. Initial concentrations: Tyr = M, DOPA = 51.2 M, DA = 18.1 M, = 228.9 M, = 1.6 M.

