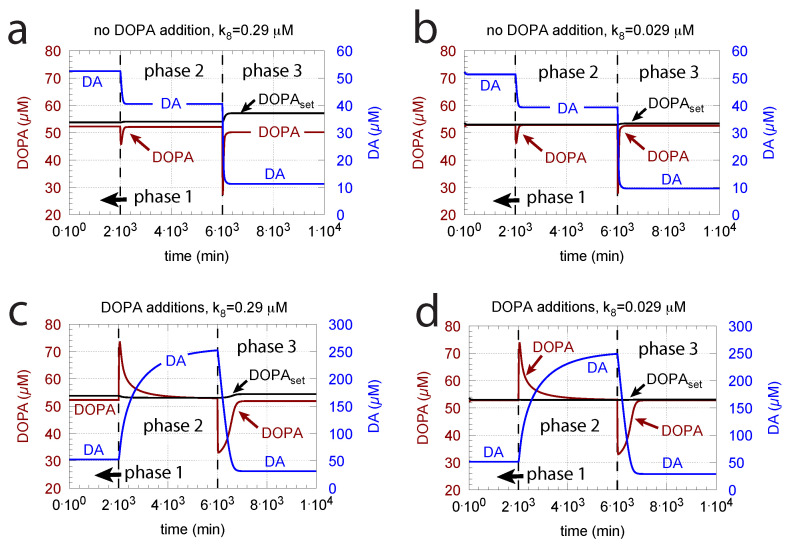
Figure 10.
DOPA addition can improve DOPA homeostasis when . Panels a and b show reference calculations with two different values (representing different controller accuracies) when DOPA is not added ( = 0 M/min). Panels c and d show the effect of DOPA additions. For all panels, (a–d): phase 1, no DOPA addition; phase 2, = 2 M/min addition; phase 3, = 4 M/min addition. Other rate constant values are as in Figure 9. Initial concentrations in panels a and c are as in Figure 9c. Initial concentrations in panels b and d are as in Figure 9b.

