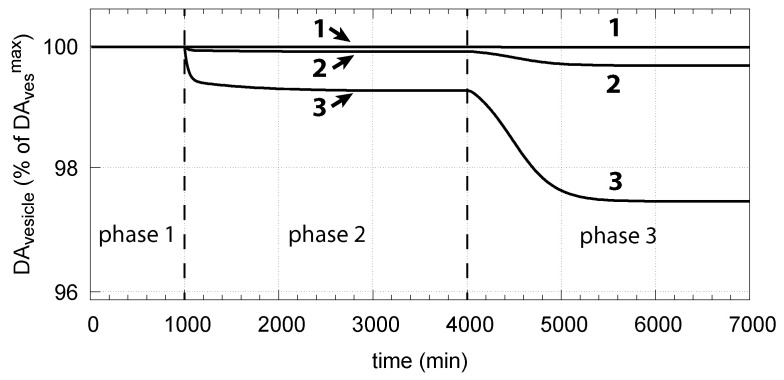
Figure 14.
Vesicular DA concentration as a function of perturbation and controller accuracy . The step-wise changes in for phases 2 and 3, as well as the other rate constants and initial concentrations, are the same as in Figure 6. Curves 1, 2, and 3 refer to the conditions of Figure 6a,c,d, respectively.

