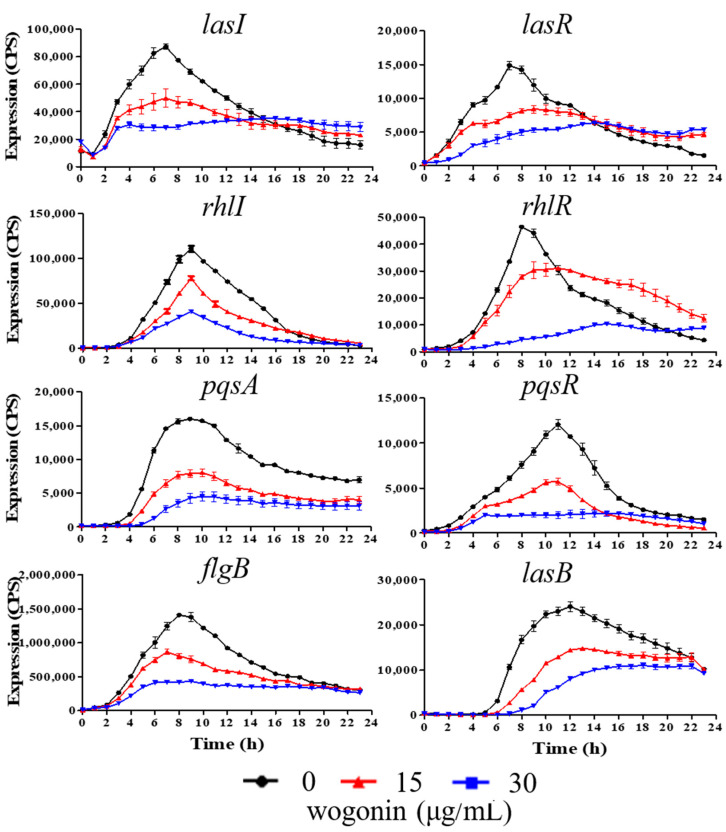
Figure 2.
The transcriptional profiles of the genes related to QS systems under the conditions of different concentrations of wogonin. Black lines, no wogonin; red lines, 15 μg/mL wogonin; blue lines, 30 μg/mL wogonin. The promoter activities were measured using a lux-reporter system. The relative expression values of various genes were presented as CPS (Count Per Second) normalized to OD600. The error bars represent standard errors.

