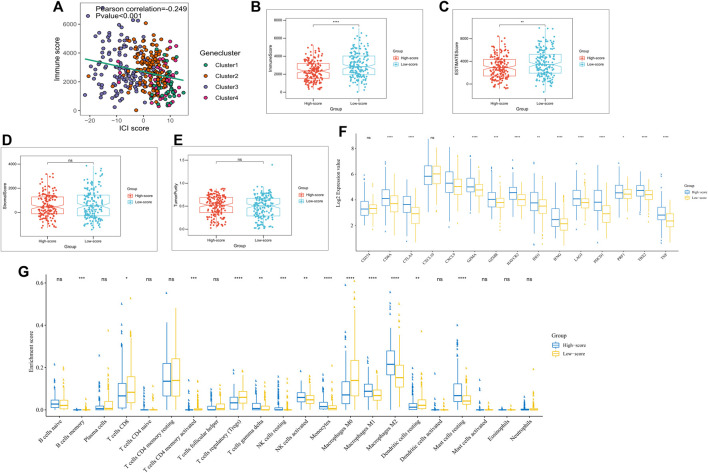
FIGURE 4.
Immune landscape of subgroups with different ICI scores. (A) Scatter plots depicting a negative correlation between ICI scores and immune scores in the TCGA cohort, showing a Pearson correlation between ICI scores and immune scores; (B) Expression of immune checkpoint-related genes (IDO1, CD274, HAVCR2, PDCD1, CTLA4, and LAG3) and immunoreactive-related genes (CD8A, CXCL10, CXCL9, GZMA, GZMB, PRF1, IFNG, TBX2, and TNF) in high and low ICI score subgroups; (C) ICI Proportion in different ICI score subgroups; (D) Immune scores of the high and low ICI score groups; (E) ESTIMATEscores of the high and low ICI score groups; (F) Stromal scores in the high and low ICI score subgroups; (G) Tumor purity in the high and low ICI score subgroups. *p < 0.05; ∗∗p < 0.01; ∗∗∗∗p < 0.001; ∗∗∗∗p < 0.0001.

