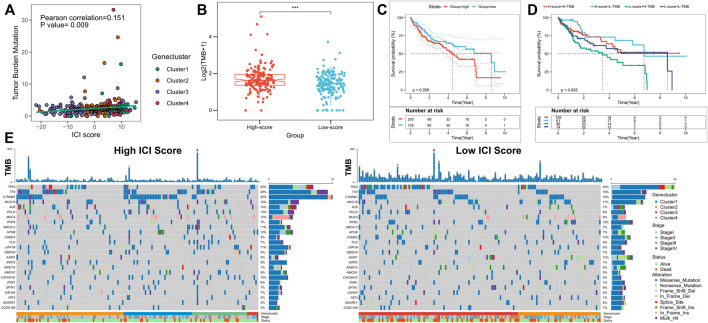
FIGURE 5.
Correlation between ICI scores and somatic cell variation. (A) Difference in TMB between the high and low ICI score subgroups, where p < 0.001 for Wilcoxon test; (B) Scatter plot depicting a positive correlation between ICI scores and the mutational burden in the TCGA cohort, showing the Pearson correlation between ICI scores and the mutational burden; (C) Kaplan-Meier curves for the high and low TMB score subgroups in the TCGA cohort, where p = 0.056 for the log-rank test; (D) Kaplan-Meier curves for patients in the TCGA cohort stratified by TMB and ICI scores, where p = 0.002 for the log-rank test; (E) “oncoplot”showing the high and low ICI score subgroups for the top 25 mutant genes, with each column representing one patient.

