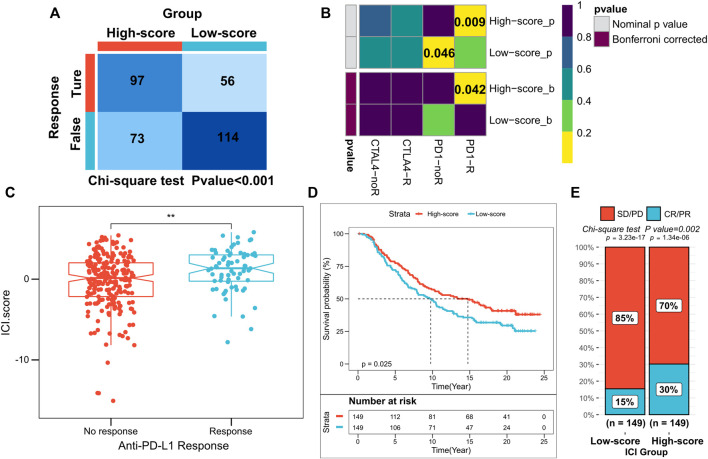
FIGURE 6.
Role of ICI scores in predicting the efficacy of immunotherapy. (A) TIDE algorithm showing higher immunotherapy response in patients with high ICI scores, where p < 0.001 for the chi-square test; (B) Subclass mapping showing higher sensitivity to anti-PD1 treatment in patients with high-score subgroups (FDR = 0.042); (C) ICI scores for subgroups with different anti-PD-1 clinical response status, where p < 0.01 for the Wilcoxon test; (D) Kaplan-Meier curves for patients with high and low ICI scores in the IMvigor210 cohort, where p = 0.025 for the log-rank test; (d) Clinical response rates to anti-PD-L1 immunotherapy in the high or low ICI score subgroups in the IMvigor210 cohort [complete response (CR)/partial response (PR) and stable disease (SD)/progressive disease (PD)].

