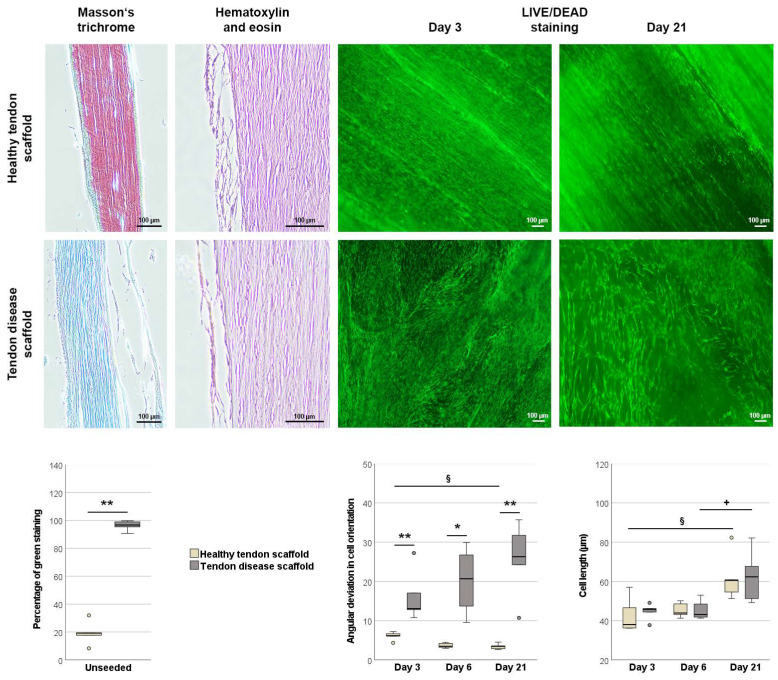
Figure 4.
Morphological analysis of unseeded and MSC-seeded healthy and diseased tendon scaffolds. Masson’s trichrome staining was performed to confirm tendon disease using unseeded scaffolds. Healthy scaffolds stained mainly red, representing healthy tendon fibers, while tendon disease scaffolds stained mainly green, representing altered tendon tissue. The boxplot displays the percentage of green staining. Hematoxylin and eosin staining of seeded tendon scaffolds showed that cell layers were mostly found on the scaffold surface, with no major differences between the scaffold groups. Live/Dead staining (live cells shown in green) of tendon scaffold cultures revealed a more random orientation of MSCs on the disease scaffolds, as quantified by the mean angular deviation from the median angle in cell orientation shown in the boxplot. It also showed that MSC length increased over time, which was also quantitatively confirmed as shown in the boxplot. All scale bars: 100 µm. Asterisks indicate significant differences between groups with p < 0.05 (*) or p < 0.01 (**). Significant differences over time are indicated by paragraph symbols for healthy tendon scaffold cultures and by plus symbols for diseased tendon scaffold cultures (p < 0.05). Data were obtained using scaffolds from n = 5 different tendons per group.

