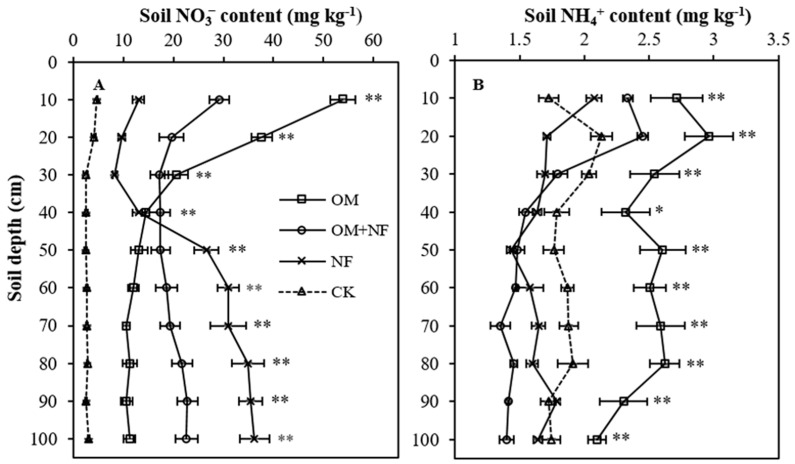
Figure 3.
Effect of five years of continuous N equivalent fertilizer substitution treatments on the depth distribution of NO3− (A) and NH4+ (B) in the soil profile. ** Significant differences among treatments at p < 0.01, * significant differences among treatments at p < 0.05. OM, organic manure; OM + NF, organic manure with nitrogen fertilizer; NF, nitrogen fertilizer; CK, control.

