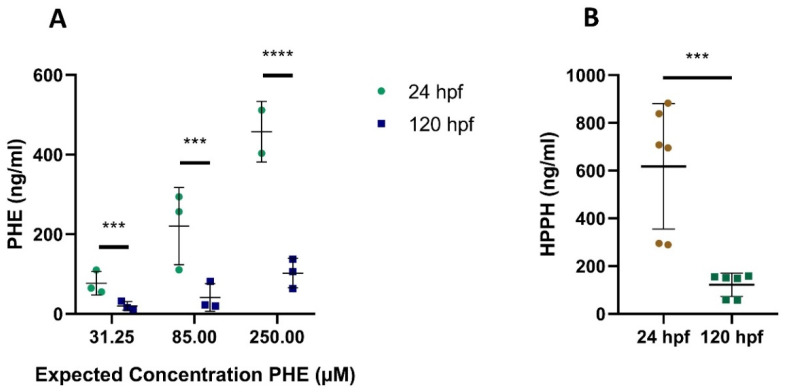
Figure 4.
Quantified PHE and HPPH in extraction samples from whole zebrafish embryos/larvae at 24 and 120 h post fertilization (hpf) after exposure to PHE 31.25 µM (7.88 µg/mL), 85 µM (21.4 µg/mL), 250 µM (63 µg/mL) (A) and HPPH 250 µM (67 µg/mL) (B). For (A) each value represents the average of the technical duplicates, whereas each technical duplicate is presented in (B). *** p ≤ 0.001; **** p ≤ 0.0001.

