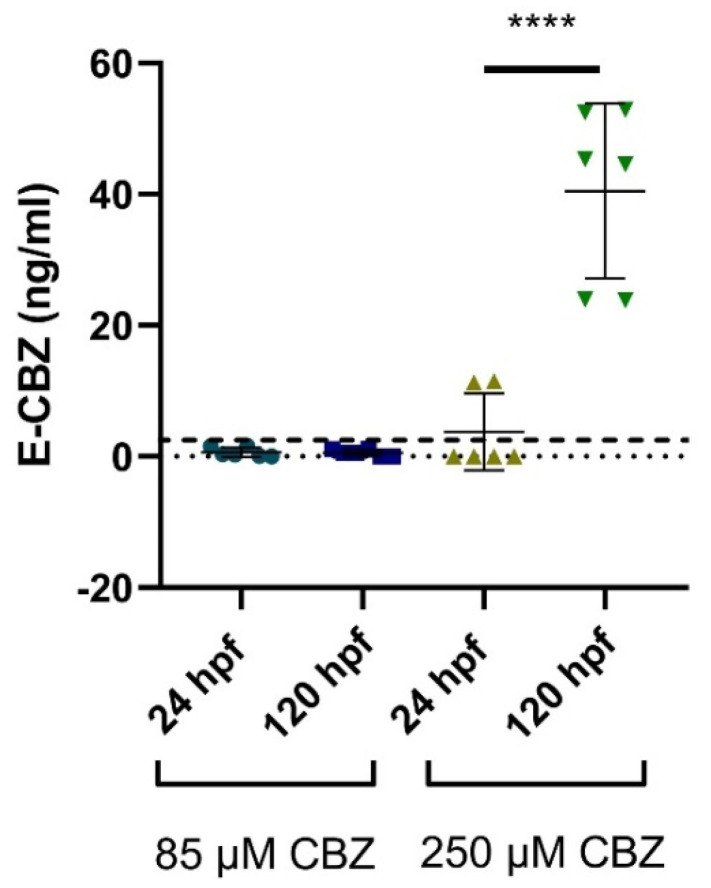
Figure 6.
Quantified E-CBZ in extraction samples from whole zebrafish embryos/larvae at 24 and 120 h post fertilization (hpf) after zebrafish embryo exposure to CBZ 85 µM (20 µg/mL)–250 µM (59 µg/mL). Each biological replicate was performed in technical duplicate, all represented in the graph. The bold dashed line (- - -) represent the LLOQ of the compound investigated. **** p ≤ 0.0001.

