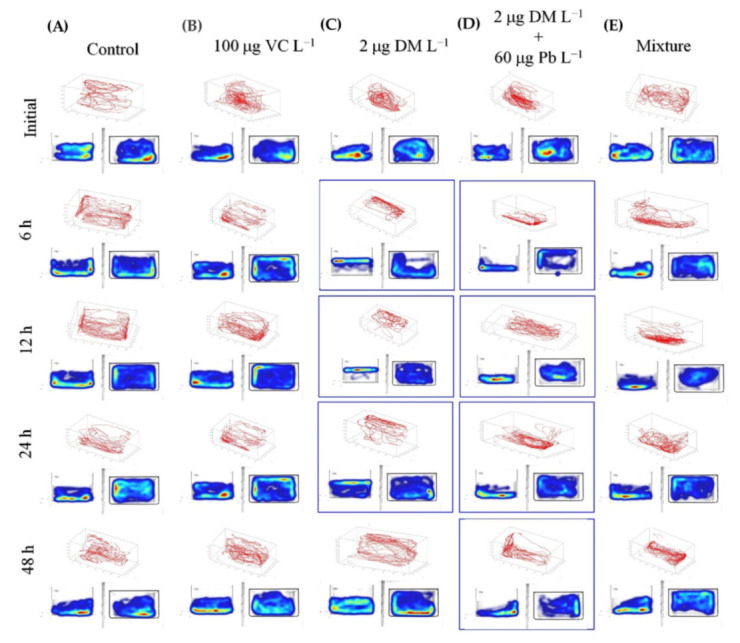
Figure 1.

The 3D swim traces results for zebrafish control group (A) and groups treated with (B) 100 μg VC L−1, (C) 2 µg DM L−1, (D) 2 µg DM L−1 + 60 µg Pb L−1 and (E) mixture of VC, Pb and DM at 0, 6, 12, 24 and 48 h (n = 15). An automated integration of traces using Track3D software results in 3D swim tracks (red color). The bottom panels show the side and top view of zebrafish in the 4 min test.
