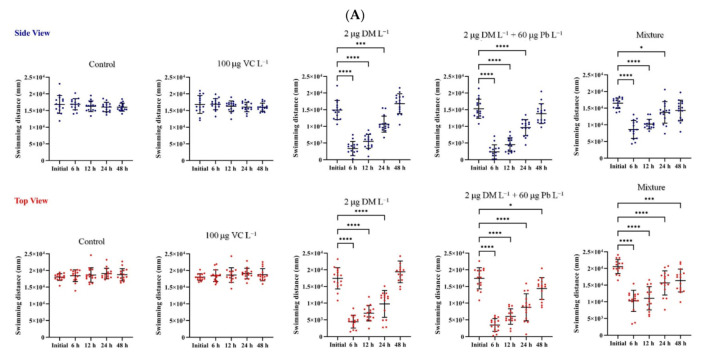
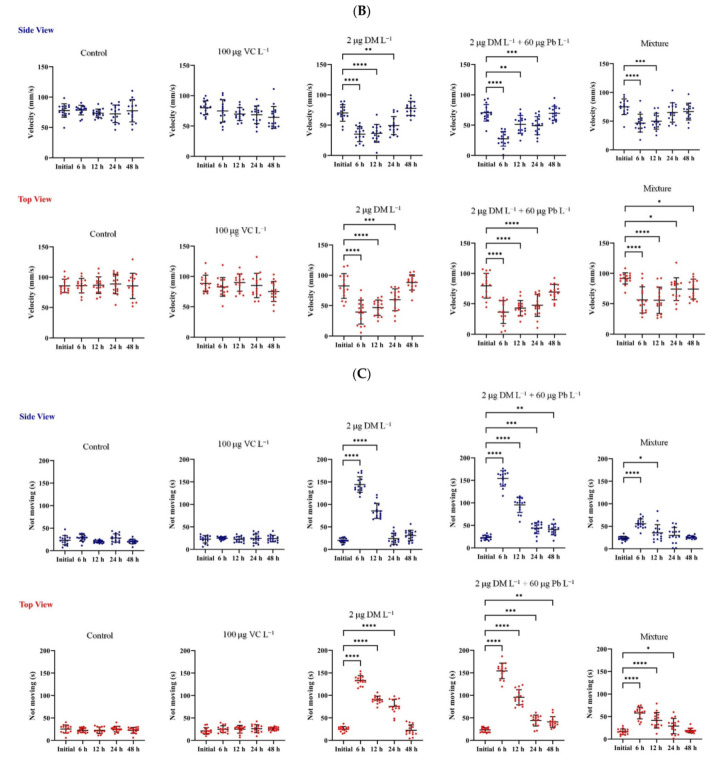
Figure 2.
3D locomotor activity assay for control and treated groups with 100 μg VC L−1, 2 µg DM L−1, 2 µg DM L−1 + 60 µg Pb L−1 and mixture of VC, Pb and DM. The graphs show (A) the total distance in the 3D space covered by the zebrafish (mm), (B) the velocity (mm/s) and (C) freezing duration (s) under the condition of no exposure and exposure to chemicals. Each dot represents an individual zebrafish (n = 15 each experimental group). Data were expressed as mean ± SD. Statistically significant differences are denoted by * p< 0.05, ** p < 0.01, *** p < 0.001, **** p < 0.0001 (one-way ANOVA, followed by a Dunnett’s multiple comparisons test).


