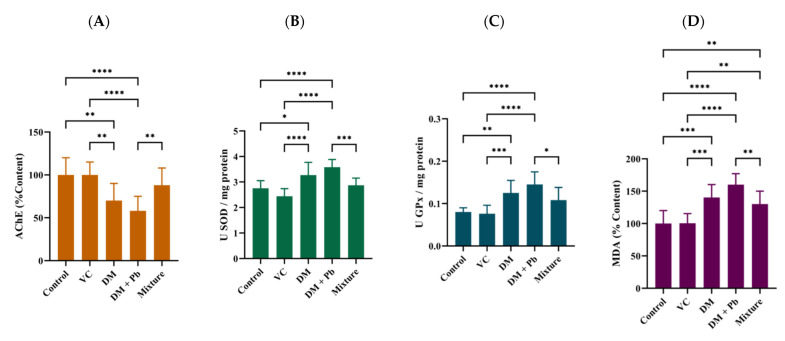
Figure 3.
Activity of (A) AChE, (B) SOD, (C) GPx and (D) MDA levels in zebrafish following treatment with vitamin C (100 μg L−1), DM (2 μg L−1) and Pb (60 μg L−1) alone and in combination with VC (100 μg L−1) for 48 h. Values are expressed as means ± SD (n = 9). Statistically significant differences are denoted by * p < 0.05, ** p < 0.01, *** p < 0.001, **** p < 0.0001 (one-way ANOVA, followed by a Turkey’s test).

