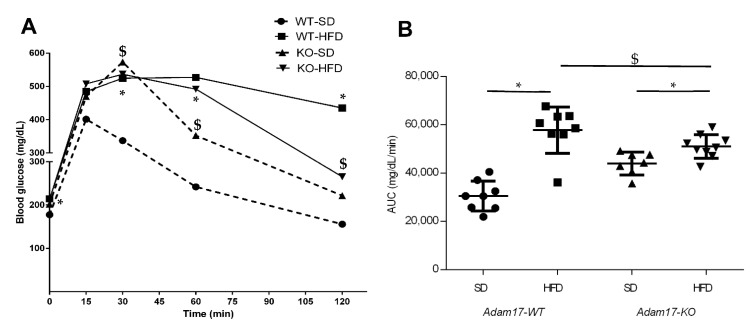
Figure 1.
Intraperitoneal glucose tolerance tests performed at 32 weeks of age in male mice. (A) Blood glucose levels were measured at 0, 15, 30, 60, and 120 min post glucose bolus injection. (B) Area under the curve was calculated. Data are expressed as mean ± SD. Abbreviations: SD, standard diet; HFD, high-fat diet; Adam17WT, wild type; Adam17KO, knockout. * p < 0.05 HFD vs. SD; $ p < 0.05 KO vs. WT.

