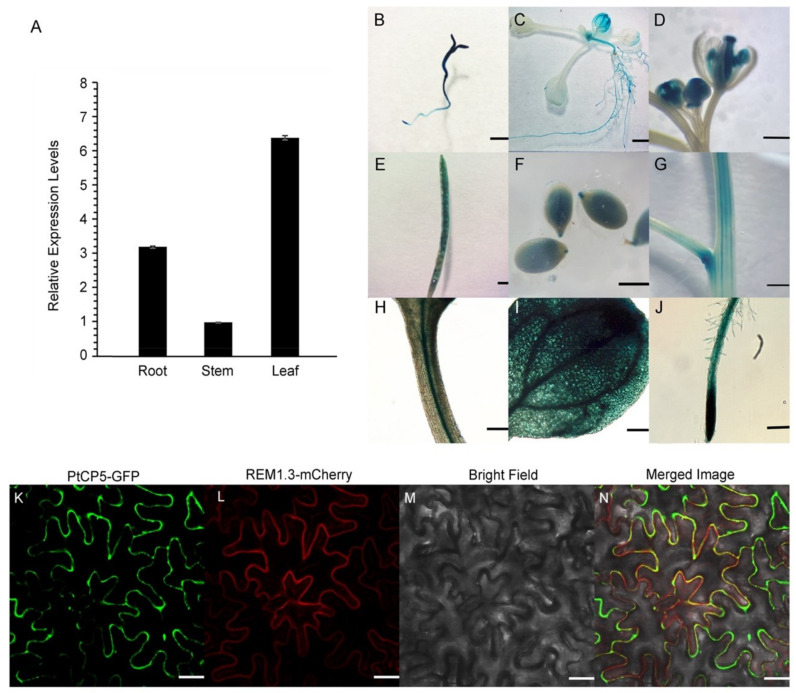
Figure 3.
Expression patterns of PtCP5: (A) PtCP5 in P. trichocarpa. The expression levels were normalized to that of β-actin-F and β-actin-R. Data are mean ± SE (n = 3 experiments). (B–J) proPtCP5:GUS expression patterns in Arabidopsis: seedling (B); cotyledons (C); flower (D); siliques (E); seed (F); stem (G); petiole (H); leaf (I); and root (J). (B–G) bar = 1 mm, (H–J) bar = 250 μm. (K–N) Subcellular fluorescence localization of PtCP5-GFP, bar = 30 μm.

