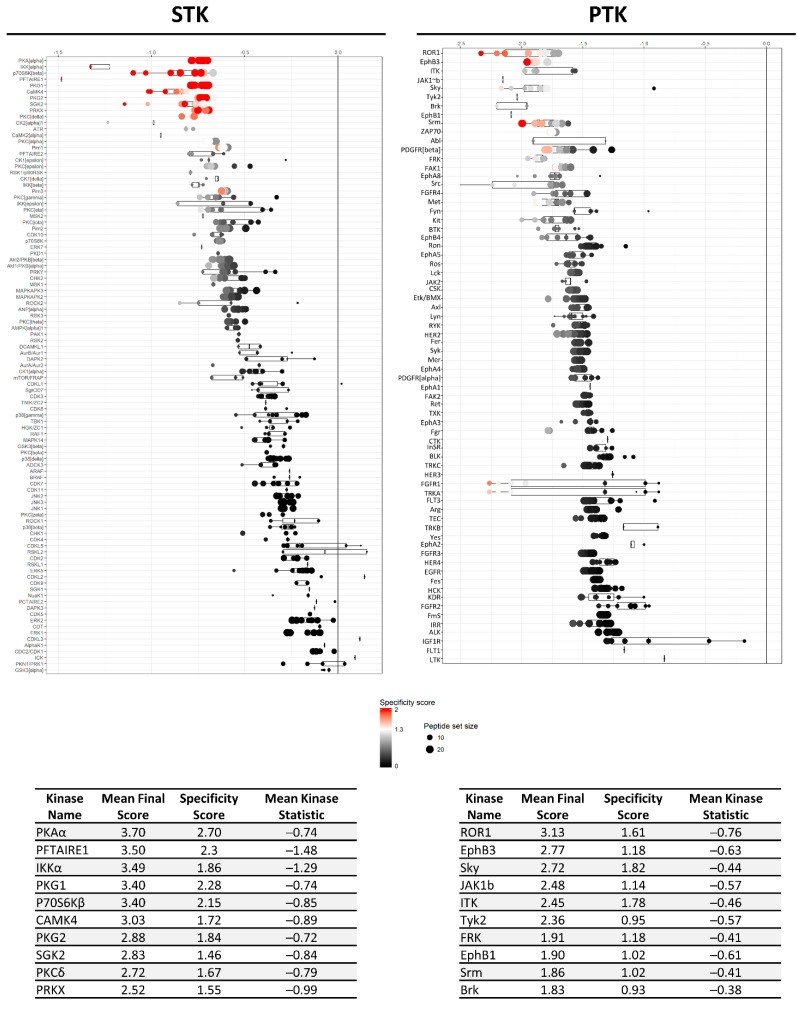
Figure 7.
Mean final score plots of serine/threonine (STK) and tyrosine kinase (PTK) activity profiling in MM1R cells treated with 1 μM withaferin a (WA) 3 h. Plots display the predicted upstream STK ranked by their final score. The x-axis indicates the values for the normalized kinase statistic, which reflects the activity difference after treatment (e.g., negative values represent inhibited kinase activity). The size of each dot visualizes the size of the peptide set used for the upstream kinase prediction analysis. The color of the points depicts the specificity score, which indicates the specificity of the normalized kinase statistic with respect to the number of peptides used for predicting the corresponding kinase. Below each figure, a table displaying the top 10 ranked kinases and their kinase statistic and specificity score is presented. The final ranking of the kinases is based on the mean final score.

